2522 208th St E Spanaway, WA 98387
Estimated Value: $562,000 - $616,461
4
Beds
2
Baths
1,899
Sq Ft
$312/Sq Ft
Est. Value
About This Home
This home is located at 2522 208th St E, Spanaway, WA 98387 and is currently estimated at $591,865, approximately $311 per square foot. 2522 208th St E is a home located in Pierce County with nearby schools including Shining Mountain Elementary School, Bethel Middle School, and Bethel High School.
Ownership History
Date
Name
Owned For
Owner Type
Purchase Details
Closed on
Apr 14, 2006
Sold by
Mcqueen Johnny D
Bought by
Dunivan Richard L and Dunivan Tami M
Current Estimated Value
Home Financials for this Owner
Home Financials are based on the most recent Mortgage that was taken out on this home.
Original Mortgage
$192,000
Outstanding Balance
$115,909
Interest Rate
7.25%
Mortgage Type
Fannie Mae Freddie Mac
Estimated Equity
$475,956
Purchase Details
Closed on
Feb 8, 2002
Sold by
Bullock William C
Bought by
Mcqueen Johnny D
Purchase Details
Closed on
Apr 24, 1997
Sold by
Xu Nan Xing
Bought by
Bullock William C and Njynski Alexandra O
Home Financials for this Owner
Home Financials are based on the most recent Mortgage that was taken out on this home.
Original Mortgage
$134,130
Interest Rate
7.96%
Mortgage Type
VA
Create a Home Valuation Report for This Property
The Home Valuation Report is an in-depth analysis detailing your home's value as well as a comparison with similar homes in the area
Home Values in the Area
Average Home Value in this Area
Purchase History
| Date | Buyer | Sale Price | Title Company |
|---|---|---|---|
| Dunivan Richard L | $240,000 | Ticor Title Of Wa Inc | |
| Mcqueen Johnny D | $175,000 | First American Title Co | |
| Bullock William C | $131,500 | -- |
Source: Public Records
Mortgage History
| Date | Status | Borrower | Loan Amount |
|---|---|---|---|
| Open | Dunivan Richard L | $192,000 | |
| Previous Owner | Bullock William C | $134,130 |
Source: Public Records
Tax History
| Year | Tax Paid | Tax Assessment Tax Assessment Total Assessment is a certain percentage of the fair market value that is determined by local assessors to be the total taxable value of land and additions on the property. | Land | Improvement |
|---|---|---|---|---|
| 2025 | $6,156 | $584,000 | $270,000 | $314,000 |
| 2024 | $6,156 | $570,100 | $270,000 | $300,100 |
| 2023 | $6,156 | $535,900 | $265,900 | $270,000 |
| 2022 | $5,882 | $556,500 | $265,900 | $290,600 |
| 2021 | $5,352 | $385,300 | $147,400 | $237,900 |
| 2019 | $3,911 | $347,400 | $129,500 | $217,900 |
| 2018 | $4,484 | $325,800 | $129,500 | $196,300 |
| 2017 | $4,020 | $291,900 | $108,500 | $183,400 |
| 2016 | $3,909 | $243,500 | $104,800 | $138,700 |
| 2014 | $3,394 | $236,000 | $104,800 | $131,200 |
| 2013 | $3,394 | $213,100 | $90,400 | $122,700 |
Source: Public Records
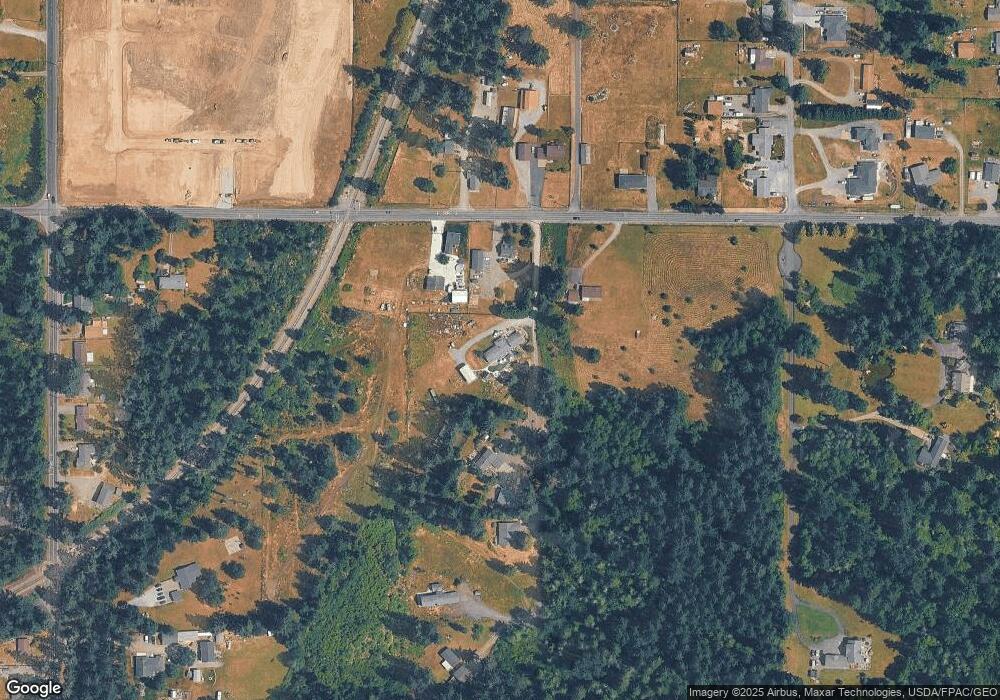
Map
Nearby Homes
- 21415 23rd Ave E
- 2910 201st Street Ct E
- 200th 256th St E
- 2022 201st St E
- 21701 31st Ave E
- 19851 23rd Avenue Ct E
- 20208 17th Avenue Ct E
- 20101 17th Avenue Ct E
- 208th 231st St E
- 20402 15th Avenue Ct E
- 1609 200th Street Ct E
- 1524 199th St E
- 1803 197th Street Ct E
- 19631 19th Avenue Ct E
- 19503 22nd Ave E
- 19519 19th Avenue Ct E
- 22302 30th Ave E
- 20508 40th Avenue Ct E
- 1221 201st Street Ct E
- 4011 214th Street Ct E
- 21016A 26th Ave E
- 2518 208th St E
- 2514 208th St E
- 2515 208th St E
- 21024 26th Ave E
- 2611 208th St E
- 2605 208th St E
- 21118 26th Ave E
- 2701 208th St E
- 2311 208th St E Unit 38067265
- 2311 208th St E Unit 38067229
- 2311 208th St E Unit 38066649
- 2311 208th St E Unit 38066589
- 2311 208th St E Unit 38066551
- 2311 208th St E Unit 38066512
- 2311 208th St E Unit 38066470
- 2311 208th St E Unit 38066409
- 2311 208th St E Unit 38066380
- 2311 208th St E Unit 38066096
- 2311 208th St E
Your Personal Tour Guide
Ask me questions while you tour the home.