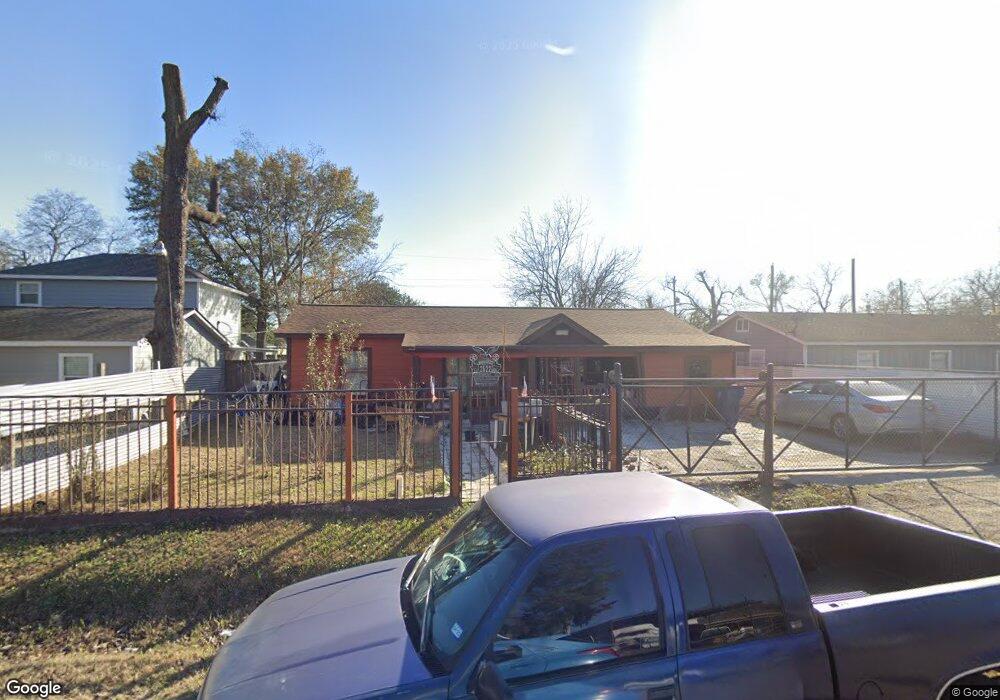
2522 Wardmont St Houston, TX 77093
East Aldine NeighborhoodEstimated Value: $148,000 - $205,000
3
Beds
1
Bath
862
Sq Ft
$208/Sq Ft
Est. Value
About This Home
This home is located at 2522 Wardmont St, Houston, TX 77093 and is currently estimated at $179,665, approximately $208 per square foot. 2522 Wardmont St is a home located in Harris County with nearby schools including Vardeman EC/PK/K, Worsham Elementary School, and Macarthur Ninth Grade School.
Ownership History
Date
Name
Owned For
Owner Type
Purchase Details
Closed on
Apr 24, 2007
Sold by
Hud
Bought by
Gonzales Adolfo C
Current Estimated Value
Home Financials for this Owner
Home Financials are based on the most recent Mortgage that was taken out on this home.
Original Mortgage
$60,714
Outstanding Balance
$36,608
Interest Rate
6.1%
Mortgage Type
FHA
Estimated Equity
$143,057
Purchase Details
Closed on
Oct 6, 2006
Sold by
Wells Fargo Bank Na
Bought by
Hud
Purchase Details
Closed on
Oct 3, 2006
Sold by
Jenkins Winifred and Jenkins Edward
Bought by
Wells Fargo Bank Na
Purchase Details
Closed on
Mar 7, 2005
Sold by
Mandrell Wayland Carrol and Mandrell Rose Mary
Bought by
Jenkins Edward
Home Financials for this Owner
Home Financials are based on the most recent Mortgage that was taken out on this home.
Original Mortgage
$67,467
Interest Rate
5.71%
Mortgage Type
FHA
Create a Home Valuation Report for This Property
The Home Valuation Report is an in-depth analysis detailing your home's value as well as a comparison with similar homes in the area
Home Values in the Area
Average Home Value in this Area
Purchase History
| Date | Buyer | Sale Price | Title Company |
|---|---|---|---|
| Gonzales Adolfo C | -- | First American Title | |
| Hud | -- | None Available | |
| Wells Fargo Bank Na | $74,601 | None Available | |
| Jenkins Edward | -- | First American Title |
Source: Public Records
Mortgage History
| Date | Status | Borrower | Loan Amount |
|---|---|---|---|
| Open | Gonzales Adolfo C | $60,714 | |
| Previous Owner | Jenkins Edward | $67,467 |
Source: Public Records
Tax History Compared to Growth
Tax History
| Year | Tax Paid | Tax Assessment Tax Assessment Total Assessment is a certain percentage of the fair market value that is determined by local assessors to be the total taxable value of land and additions on the property. | Land | Improvement |
|---|---|---|---|---|
| 2025 | $1,521 | $163,006 | $43,664 | $119,342 |
| 2024 | $1,521 | $165,658 | $43,664 | $121,994 |
| 2023 | $1,521 | $175,495 | $30,534 | $144,961 |
| 2022 | $2,406 | $141,294 | $30,534 | $110,760 |
| 2021 | $2,293 | $110,445 | $30,534 | $79,911 |
| 2020 | $1,737 | $0 | $0 | $0 |
| 2019 | $1,772 | $84,607 | $30,534 | $54,073 |
| 2018 | $613 | $67,706 | $14,656 | $53,050 |
| 2017 | $1,534 | $67,706 | $14,656 | $53,050 |
| 2016 | $1,438 | $67,706 | $14,656 | $53,050 |
| 2015 | $904 | $66,538 | $14,656 | $51,882 |
| 2014 | $904 | $52,437 | $14,656 | $37,781 |
Source: Public Records
Map
Nearby Homes
- 2311 Warwick Rd
- 11716 Innsbury Dr
- 2326 Sunny Dr
- 11746 Somerset Ln
- 2237 Cromwell St
- 2817 Cromwell St
- 2306 Wardmont St
- 2629 Kowis St
- 2915 Brea Crest St
- 2723 Castledale Dr
- 2152 William Tell St
- 2131 Cromwell St Unit D
- 2636 Lone Oak Rd
- 2131 Warwick Rd
- 2123 Warwick Rd
- 2410 Mierianne St
- 2122 Kowis St
- 3214 Brea Crest St
- 1925 Sunny Dr
- 3111 Hartwick Rd
- 2526 Wardmont St
- 2518 Wardmont St
- 2514 Wardmont St
- 2530 Wardmont St
- 2501 Hopper Rd
- 2505 Hopper Rd
- 2433 Hopper Rd
- 2509 Hopper Rd
- 2519 Wardmont St
- 2602 Wardmont St
- 2510 Wardmont St
- 11603 Somerset Ln
- 2429 Hopper Rd
- 2513 Hopper Rd
- 2515 Wardmont St
- 11607 Somerset Ln
- 2610 Wardmont St
- 2517 Hopper Rd
- 2506 Wardmont St
- 2511 Wardmont St