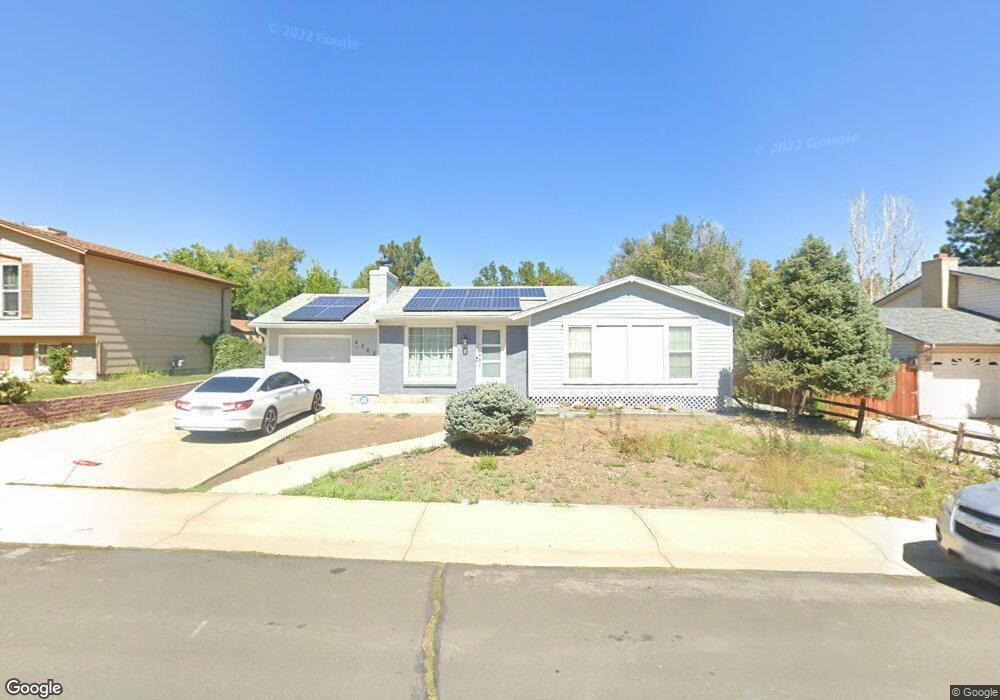
2523 E 98th Place Thornton, CO 80229
Quimby NeighborhoodEstimated Value: $457,461 - $490,000
4
Beds
2
Baths
2,022
Sq Ft
$232/Sq Ft
Est. Value
About This Home
This home is located at 2523 E 98th Place, Thornton, CO 80229 and is currently estimated at $469,365, approximately $232 per square foot. 2523 E 98th Place is a home located in Adams County with nearby schools including Trailside Academy.
Ownership History
Date
Name
Owned For
Owner Type
Purchase Details
Closed on
Dec 16, 2021
Sold by
Farnham Leslie and Estate Of Janet Postma Bugg
Bought by
Munoz Mario
Current Estimated Value
Home Financials for this Owner
Home Financials are based on the most recent Mortgage that was taken out on this home.
Original Mortgage
$455,900
Outstanding Balance
$415,723
Interest Rate
3.09%
Mortgage Type
New Conventional
Estimated Equity
$53,642
Purchase Details
Closed on
Sep 8, 2021
Sold by
Neel Bugg Gary
Bought by
Farnham Leslie
Purchase Details
Closed on
Aug 4, 2003
Sold by
Bugg Janet Postma
Bought by
Bugg Janet Postma and Bugg Gary
Home Financials for this Owner
Home Financials are based on the most recent Mortgage that was taken out on this home.
Original Mortgage
$87,500
Interest Rate
5.35%
Mortgage Type
Unknown
Purchase Details
Closed on
Nov 18, 1993
Sold by
Postma Janet Sue
Bought by
Bugg Janet Postma
Home Financials for this Owner
Home Financials are based on the most recent Mortgage that was taken out on this home.
Original Mortgage
$67,638
Interest Rate
6.71%
Mortgage Type
FHA
Create a Home Valuation Report for This Property
The Home Valuation Report is an in-depth analysis detailing your home's value as well as a comparison with similar homes in the area
Home Values in the Area
Average Home Value in this Area
Purchase History
| Date | Buyer | Sale Price | Title Company |
|---|---|---|---|
| Munoz Mario | $470,000 | First Alliance Title | |
| Farnham Leslie | -- | -- | |
| Bugg Janet Postma | -- | -- | |
| Bugg Janet Postma | -- | Stewart Title |
Source: Public Records
Mortgage History
| Date | Status | Borrower | Loan Amount |
|---|---|---|---|
| Open | Munoz Mario | $455,900 | |
| Previous Owner | Bugg Janet Postma | $87,500 | |
| Previous Owner | Bugg Janet Postma | $67,638 |
Source: Public Records
Tax History
| Year | Tax Paid | Tax Assessment Tax Assessment Total Assessment is a certain percentage of the fair market value that is determined by local assessors to be the total taxable value of land and additions on the property. | Land | Improvement |
|---|---|---|---|---|
| 2025 | $2,840 | $32,440 | $6,120 | $26,320 |
| 2024 | $2,840 | $29,820 | $5,630 | $24,190 |
| 2023 | $2,816 | $33,900 | $5,890 | $28,010 |
| 2022 | $2,274 | $22,810 | $6,050 | $16,760 |
| 2021 | $1,491 | $22,810 | $6,050 | $16,760 |
| 2020 | $1,307 | $21,200 | $5,760 | $15,440 |
| 2019 | $1,315 | $21,200 | $5,760 | $15,440 |
| 2018 | $997 | $17,230 | $5,760 | $11,470 |
| 2017 | $977 | $17,230 | $5,760 | $11,470 |
| 2016 | $637 | $12,820 | $3,100 | $9,720 |
| 2015 | $557 | $6,410 | $1,550 | $4,860 |
| 2014 | -- | $5,570 | $1,270 | $4,300 |
Source: Public Records
Map
Nearby Homes
- 2621 E 98th Ave
- 2244 E 101st Ave
- 2083 E 97th Place
- 2422 E 96th Way
- 9718 Clayton Cir
- 2684 E 97th Ave
- 9827 Race St
- 9755 High St
- 1792 E 97th Ave
- 2690 E 102nd Place
- 1838 E 98th Ave
- 2631 E 102nd Place
- 2651 E 102nd Place
- 1960 Rowena St
- 2632 E 103rd Ave
- 2652 E 103rd Ave
- 1696 E 96th Way
- 2742 E 103rd Ave
- 2980 E 102nd Place
- 10099 Williams St
- 2543 E 98th Place
- 2483 E 98th Place
- 2524 E 98th Way
- 2544 E 98th Way
- 2484 E 98th Way
- 2553 E 98th Place
- 2463 E 98th Place
- 2522 E 98th Place
- 2482 E 98th Place
- 2542 E 98th Place
- 2464 E 98th Way
- 2554 E 98th Way
- 2462 E 98th Place
- 2453 E 98th Place
- 2552 E 98th Place
- 2563 E 98th Place
- 2454 E 98th Way
- 2564 E 98th Way
- 2521 E 98th Ave
- 2525 E 98th Way
Your Personal Tour Guide
Ask me questions while you tour the home.