Estimated Value: $326,000 - $343,000
2
Beds
2
Baths
1,064
Sq Ft
$315/Sq Ft
Est. Value
About This Home
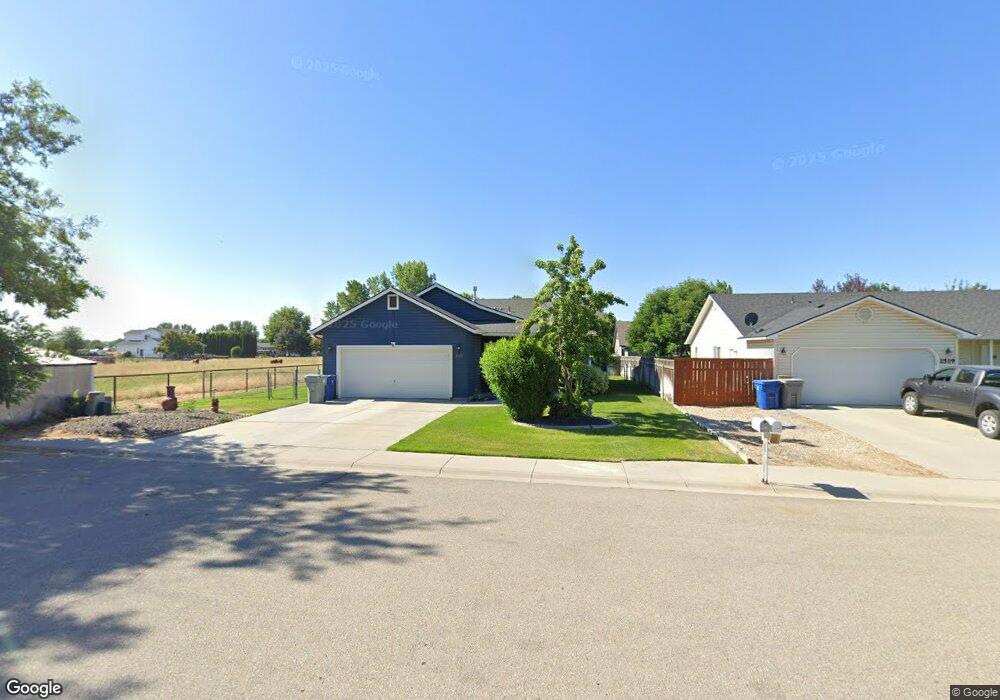
This home is located at 2523 E Lily Ave, Nampa, ID 83686 and is currently estimated at $335,102, approximately $314 per square foot. 2523 E Lily Ave is a home located in Canyon County with nearby schools including Greenhurst Elementary School, South Middle School, and Columbia High School.
Ownership History
Date
Name
Owned For
Owner Type
Purchase Details
Closed on
Aug 3, 2018
Sold by
Dick Rex M
Bought by
Theuret Jeffrey L and Theuret Mary A
Current Estimated Value
Home Financials for this Owner
Home Financials are based on the most recent Mortgage that was taken out on this home.
Original Mortgage
$85,000
Outstanding Balance
$73,819
Interest Rate
4.5%
Mortgage Type
New Conventional
Estimated Equity
$261,283
Purchase Details
Closed on
Jul 21, 2005
Sold by
Berhamovic Adnan and Berhamovic Amira
Bought by
Dick Rex M and Dick Anna K
Purchase Details
Closed on
Jan 20, 2005
Sold by
Adria Custom Homes
Bought by
Berhamovic Adnan and Berhamovic Amira
Home Financials for this Owner
Home Financials are based on the most recent Mortgage that was taken out on this home.
Original Mortgage
$50,000
Interest Rate
5.69%
Mortgage Type
Construction
Purchase Details
Closed on
Nov 12, 2004
Sold by
Enviro Smart Llc
Bought by
Adria Custom Homes
Create a Home Valuation Report for This Property
The Home Valuation Report is an in-depth analysis detailing your home's value as well as a comparison with similar homes in the area
Home Values in the Area
Average Home Value in this Area
Purchase History
| Date | Buyer | Sale Price | Title Company |
|---|---|---|---|
| Theuret Jeffrey L | -- | Pioneer Title Co | |
| Dick Rex M | -- | -- | |
| Berhamovic Adnan | -- | -- | |
| Adria Custom Homes | -- | Pioneer Title Company Of Can |
Source: Public Records
Mortgage History
| Date | Status | Borrower | Loan Amount |
|---|---|---|---|
| Open | Theuret Jeffrey L | $85,000 | |
| Previous Owner | Berhamovic Adnan | $50,000 |
Source: Public Records
Tax History Compared to Growth
Tax History
| Year | Tax Paid | Tax Assessment Tax Assessment Total Assessment is a certain percentage of the fair market value that is determined by local assessors to be the total taxable value of land and additions on the property. | Land | Improvement |
|---|---|---|---|---|
| 2025 | $1,164 | $317,600 | $96,000 | $221,600 |
| 2024 | $1,164 | $312,900 | $96,000 | $216,900 |
| 2023 | $1,081 | $306,900 | $96,000 | $210,900 |
| 2022 | $1,432 | $319,000 | $96,000 | $223,000 |
| 2021 | $1,354 | $229,800 | $50,500 | $179,300 |
| 2020 | $2,505 | $193,400 | $42,000 | $151,400 |
| 2019 | $2,706 | $168,600 | $36,000 | $132,600 |
| 2018 | $1,334 | $0 | $0 | $0 |
| 2017 | $1,223 | $0 | $0 | $0 |
| 2016 | $1,150 | $0 | $0 | $0 |
| 2015 | $1,011 | $0 | $0 | $0 |
| 2014 | $910 | $93,400 | $18,000 | $75,400 |
Source: Public Records
Map
Nearby Homes
- 1009 Poppy Dr
- 2308 E Elm Grove Dr
- 1111 Southside Blvd
- 1403 Sunflower Ct
- 1047 S 20th St
- 1426 Chicago St
- 545 Knights Cir
- 618 Dufur St
- 1810 E Sherman Ave
- 3302 E Princess Amy Ct
- 641 S Bangor Way
- 2912 E Iowa Ave
- 1801 E Iowa Ave
- 678 S Queens Dr
- 2019 Kentucky Dr
- 1716 Nixon Ave
- 3411 Wilson Ln
- 3614 E Amity Ave
- 1835 E Kentucky Ave
- 416 S Powerline Rd
- 2519 E Lily Ave
- 908 S Lily Ct
- 2601 E Amity Ave
- 904 S Lily Ct
- 2516 E Lily Ave
- 2509 E Lily Ave
- 905 S Lily Ct
- 2510 E Lily Ave
- 912 S Lily Ct
- 2505 E Lily Ave
- 2515 E Amity Ave
- 916 S Lily Ct
- 909 S Lily Ct
- 2506 E Lily Ave
- 917 S Lily Ct
- 2613 E Amity Ave
- 2509 E Amity Ave
- 2505 E Amity Ave
- 2524 E Colorado Ave
- 913 S Lily Ct