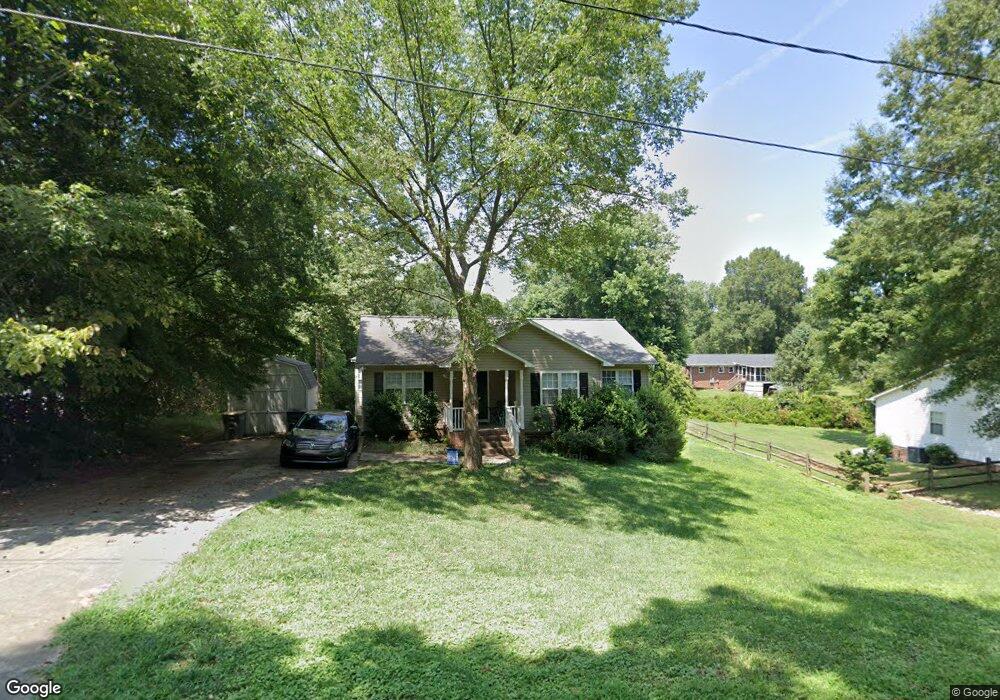
2523 Joyce St Kannapolis, NC 28083
Estimated Value: $249,189 - $280,000
Studio
2
Baths
1,156
Sq Ft
$232/Sq Ft
Est. Value
About This Home
This home is located at 2523 Joyce St, Kannapolis, NC 28083 and is currently estimated at $268,547, approximately $232 per square foot. 2523 Joyce St is a home located in Rowan County with nearby schools including Jackson Park Elementary School, Kannapolis Middle, and A.L. Brown High School.
Ownership History
Date
Name
Owned For
Owner Type
Purchase Details
Closed on
Jan 28, 2019
Sold by
Rms Investment Properties Llc
Bought by
Cerberus Sfr Holdings Ii Lp
Current Estimated Value
Home Financials for this Owner
Home Financials are based on the most recent Mortgage that was taken out on this home.
Original Mortgage
$95,283
Outstanding Balance
$83,946
Interest Rate
4.8%
Mortgage Type
Future Advance Clause Open End Mortgage
Estimated Equity
$184,601
Purchase Details
Closed on
Dec 18, 2018
Sold by
White Kenda L
Bought by
Bms Investment Properties Llc
Home Financials for this Owner
Home Financials are based on the most recent Mortgage that was taken out on this home.
Original Mortgage
$95,283
Outstanding Balance
$83,946
Interest Rate
4.8%
Mortgage Type
Future Advance Clause Open End Mortgage
Estimated Equity
$184,601
Purchase Details
Closed on
May 12, 2008
Sold by
Drye Michael D
Bought by
Drye Michael D and Cook Angelia Denise
Create a Home Valuation Report for This Property
The Home Valuation Report is an in-depth analysis detailing your home's value as well as a comparison with similar homes in the area
Home Values in the Area
Average Home Value in this Area
Purchase History
| Date | Buyer | Sale Price | Title Company |
|---|---|---|---|
| Cerberus Sfr Holdings Ii Lp | $141,000 | None Available | |
| Bms Investment Properties Llc | $95,283 | None Available | |
| Drye Michael D | -- | None Available |
Source: Public Records
Mortgage History
| Date | Status | Borrower | Loan Amount |
|---|---|---|---|
| Open | Bms Investment Properties Llc | $95,283 |
Source: Public Records
Tax History
| Year | Tax Paid | Tax Assessment Tax Assessment Total Assessment is a certain percentage of the fair market value that is determined by local assessors to be the total taxable value of land and additions on the property. | Land | Improvement |
|---|---|---|---|---|
| 2025 | $2,318 | $191,568 | $32,000 | $159,568 |
| 2024 | $2,318 | $191,568 | $32,000 | $159,568 |
| 2023 | $2,318 | $191,568 | $32,000 | $159,568 |
| 2022 | $1,583 | $122,975 | $28,000 | $94,975 |
| 2021 | $1,583 | $122,975 | $28,000 | $94,975 |
| 2020 | $1,547 | $120,173 | $28,000 | $92,173 |
| 2019 | $1,583 | $122,975 | $28,000 | $94,975 |
| 2018 | $1,189 | $93,363 | $16,500 | $76,863 |
| 2017 | $1,189 | $93,363 | $16,500 | $76,863 |
| 2016 | $1,189 | $93,363 | $16,500 | $76,863 |
| 2015 | $1,207 | $93,363 | $16,500 | $76,863 |
| 2014 | $1,179 | $94,326 | $16,500 | $77,826 |
Source: Public Records
Map
Nearby Homes
- 2600 Haven St
- 2551 Glenwood St
- 2550 Echerd St
- 2690 Trawler Way
- 2680 Trawler Way
- 2670 Trawler Way
- 2685 Trawler Way
- 2420 Lane St
- 2710 Trawler Way
- 2705 Trawler Way
- 2715 Trawler Way
- 1200 Fisher Springs Ln Unit 19
- 1205 Fisher Springs Ln
- 453 China Grove Rd
- 545 Collins St
- 2137 Lane St
- 1500 Nectar Way Unit 32
- 3045 Swallowtail Ln
- 3000 Swallowtail Ln Unit 40
- 3005 Swallowtail Ln Unit 41
Your Personal Tour Guide
Ask me questions while you tour the home.