2523 Lipton Rd Columbus, OH 43232
Walnut Heights NeighborhoodEstimated Value: $205,428 - $221,000
3
Beds
1
Bath
1,336
Sq Ft
$160/Sq Ft
Est. Value
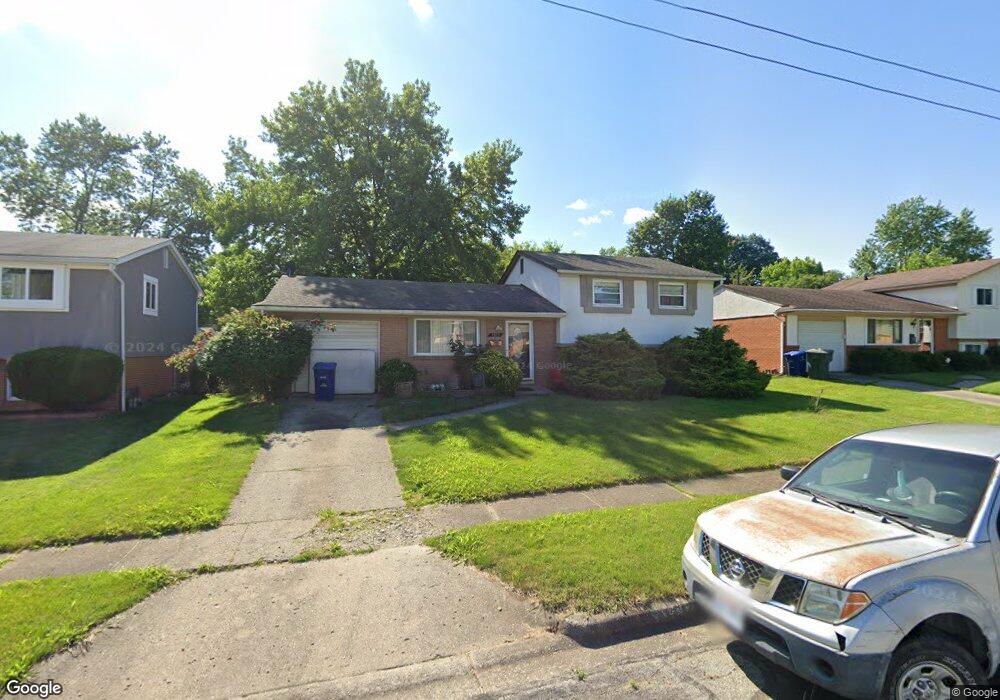
About This Home
This home is located at 2523 Lipton Rd, Columbus, OH 43232 and is currently estimated at $213,107, approximately $159 per square foot. 2523 Lipton Rd is a home located in Franklin County with nearby schools including Liberty Elementary School, Yorktown Middle School, and Independence High School.
Ownership History
Date
Name
Owned For
Owner Type
Purchase Details
Closed on
Feb 15, 2006
Sold by
Dejon Diana
Bought by
Cabrera Jose S Lovo
Current Estimated Value
Home Financials for this Owner
Home Financials are based on the most recent Mortgage that was taken out on this home.
Original Mortgage
$89,300
Outstanding Balance
$50,272
Interest Rate
6.2%
Mortgage Type
Purchase Money Mortgage
Estimated Equity
$162,835
Purchase Details
Closed on
Jun 21, 2005
Sold by
Dejon Diana
Bought by
Dejon Diana
Create a Home Valuation Report for This Property
The Home Valuation Report is an in-depth analysis detailing your home's value as well as a comparison with similar homes in the area
Home Values in the Area
Average Home Value in this Area
Purchase History
| Date | Buyer | Sale Price | Title Company |
|---|---|---|---|
| Cabrera Jose S Lovo | $99,300 | Chicago Tit | |
| Dejon Diana | -- | -- |
Source: Public Records
Mortgage History
| Date | Status | Borrower | Loan Amount |
|---|---|---|---|
| Open | Cabrera Jose S Lovo | $89,300 |
Source: Public Records
Tax History Compared to Growth
Tax History
| Year | Tax Paid | Tax Assessment Tax Assessment Total Assessment is a certain percentage of the fair market value that is determined by local assessors to be the total taxable value of land and additions on the property. | Land | Improvement |
|---|---|---|---|---|
| 2024 | $2,663 | $59,330 | $17,990 | $41,340 |
| 2023 | $2,629 | $59,325 | $17,990 | $41,335 |
| 2022 | $1,723 | $33,220 | $6,510 | $26,710 |
| 2021 | $1,726 | $33,220 | $6,510 | $26,710 |
| 2020 | $1,728 | $33,220 | $6,510 | $26,710 |
| 2019 | $1,695 | $27,940 | $5,430 | $22,510 |
| 2018 | $1,573 | $27,940 | $5,430 | $22,510 |
| 2017 | $1,694 | $27,940 | $5,430 | $22,510 |
| 2016 | $1,602 | $24,190 | $4,480 | $19,710 |
| 2015 | $1,455 | $24,190 | $4,480 | $19,710 |
| 2014 | $1,458 | $24,190 | $4,480 | $19,710 |
| 2013 | $798 | $26,845 | $4,970 | $21,875 |
Source: Public Records
Map
Nearby Homes
- 2342 Noe Bixby Rd
- 2336 Noe Bixby Rd
- 2360 Noe Bixby Rd
- 2354 Noe Bixby Rd
- 2348 Noe Bixby Rd
- 2150 Noe Bixby Rd
- 2615 Carbondale Place
- 0 Noe Bixby Rd
- 2746 Noe Bixby Rd
- 5061 Labelle Dr
- 5011 Refugee Rd
- 5114 Carbondale Dr
- 5123 Jameson Dr
- 2447 Maybury Rd
- 2173 Noe Bixby Rd
- 2900 Ronda Rd
- 2901 Renfro Rd
- 5144 Botsford Dr
- 2705 Denmark Rd
- 5125 Upton Rd N