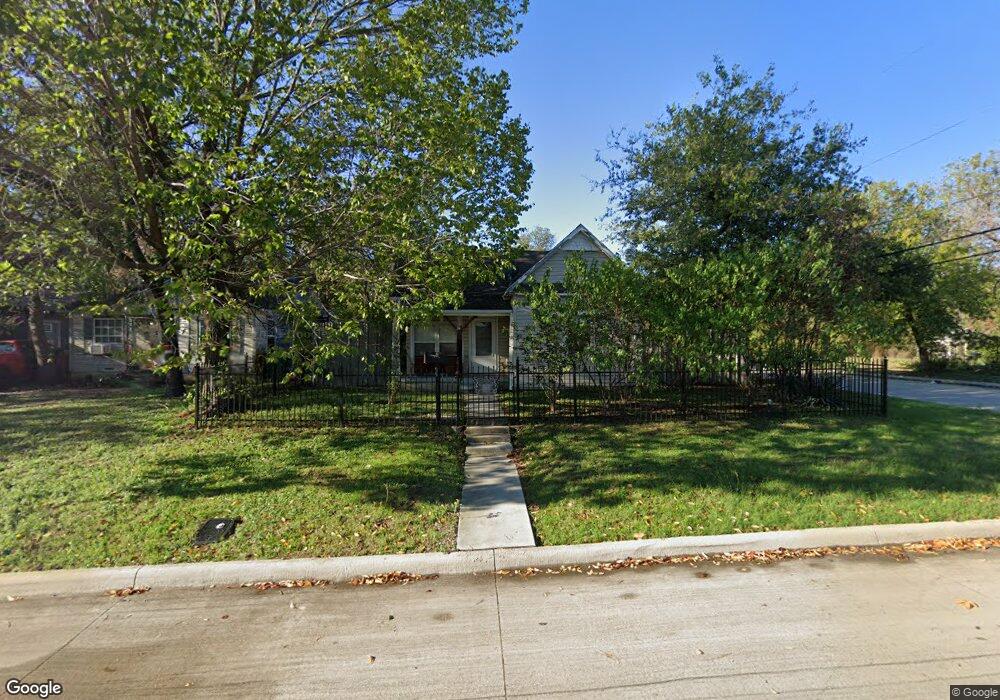
2523 NW Loraine St Fort Worth, TX 76106
Northside NeighborhoodEstimated Value: $200,553 - $235,000
3
Beds
1
Bath
996
Sq Ft
$216/Sq Ft
Est. Value
About This Home
This home is located at 2523 NW Loraine St, Fort Worth, TX 76106 and is currently estimated at $215,388, approximately $216 per square foot. 2523 NW Loraine St is a home located in Tarrant County with nearby schools including Dolores Huerta Elementary School, Kirkpatrick Middle School, and North Side High School.
Ownership History
Date
Name
Owned For
Owner Type
Purchase Details
Closed on
Aug 31, 2017
Sold by
Vazquez Diego Guadalupe
Bought by
Martinez Mirna Mariela
Current Estimated Value
Home Financials for this Owner
Home Financials are based on the most recent Mortgage that was taken out on this home.
Original Mortgage
$60,000
Outstanding Balance
$50,091
Interest Rate
3.89%
Mortgage Type
New Conventional
Estimated Equity
$165,297
Purchase Details
Closed on
Jan 24, 2006
Sold by
Meza Jose
Bought by
Vazquez Diego
Home Financials for this Owner
Home Financials are based on the most recent Mortgage that was taken out on this home.
Original Mortgage
$60,000
Interest Rate
8.25%
Mortgage Type
Fannie Mae Freddie Mac
Purchase Details
Closed on
Jul 25, 2005
Sold by
Spencer M M and Spencer Tina Marie
Bought by
Meza Jose
Purchase Details
Closed on
Mar 4, 1994
Sold by
Henley Joe E and Henley Dixie A
Bought by
Spencer M
Create a Home Valuation Report for This Property
The Home Valuation Report is an in-depth analysis detailing your home's value as well as a comparison with similar homes in the area
Home Values in the Area
Average Home Value in this Area
Purchase History
| Date | Buyer | Sale Price | Title Company |
|---|---|---|---|
| Martinez Mirna Mariela | -- | None Available | |
| Vazquez Diego | -- | Republic Title Of Texas | |
| Meza Jose | -- | Blue Star Title Inc | |
| Spencer M | -- | -- |
Source: Public Records
Mortgage History
| Date | Status | Borrower | Loan Amount |
|---|---|---|---|
| Open | Martinez Mirna Mariela | $60,000 | |
| Previous Owner | Vazquez Diego | $60,000 |
Source: Public Records
Tax History Compared to Growth
Tax History
| Year | Tax Paid | Tax Assessment Tax Assessment Total Assessment is a certain percentage of the fair market value that is determined by local assessors to be the total taxable value of land and additions on the property. | Land | Improvement |
|---|---|---|---|---|
| 2025 | $1,140 | $168,879 | $50,095 | $118,784 |
| 2024 | $1,140 | $168,879 | $50,095 | $118,784 |
| 2023 | $2,232 | $175,132 | $40,475 | $134,657 |
| 2022 | $2,331 | $104,698 | $13,000 | $91,698 |
| 2021 | $2,236 | $81,521 | $13,000 | $68,521 |
| 2020 | $2,016 | $76,158 | $13,000 | $63,158 |
| 2019 | $1,921 | $76,754 | $13,000 | $63,754 |
| 2018 | $1,309 | $63,497 | $13,000 | $50,497 |
| 2017 | $1,619 | $57,151 | $13,000 | $44,151 |
| 2016 | $1,009 | $35,612 | $13,000 | $22,612 |
| 2015 | $1,538 | $54,200 | $13,120 | $41,080 |
| 2014 | $1,538 | $54,200 | $13,120 | $41,080 |
Source: Public Records
Map
Nearby Homes
- 2517 NW 29th St
- 2717 NW 27th St
- 2719 NW 25th St
- Lot 3B Lake Prarie Trail
- 2707 NW 24th St
- 2705 NW 34th St
- 2907 NW 26th St
- 2922 Columbus Ave
- 2713 NW 35th St
- 3009 Columbus Ave
- 2919 Columbus Ave
- 2500 NW 20th St
- 2610 Columbus Ave
- 2958 Columbus Ave
- 2961 Pearl Ave
- 2913 Pearl Ave
- 2814 NW 20th St
- 2929 Angle Ave
- 2921 Market Ave
- 2927 Angle Ave
- 2521 NW Loraine St
- 2519 NW Loraine St
- 2603 NW Loraine St
- 2517 NW Loraine St
- 2522 NW 28th St
- 2522 NW Loraine St
- 2518 NW 28th St
- 2600 NW 28th St
- 2520 NW Loraine St
- 2515 NW Loraine St
- 2605 NW Loraine St
- 2600 NW Loraine St
- 2518 NW Loraine St
- 2516 NW 28th St
- 2602 NW 28th St
- 2516 NW Loraine St
- 2602 NW Loraine St
- 2513 NW Loraine St
- 2607 NW Loraine St
- 2514 NW 28th St