Estimated Value: $378,000 - $392,000
3
Beds
2
Baths
1,912
Sq Ft
$202/Sq Ft
Est. Value
About This Home
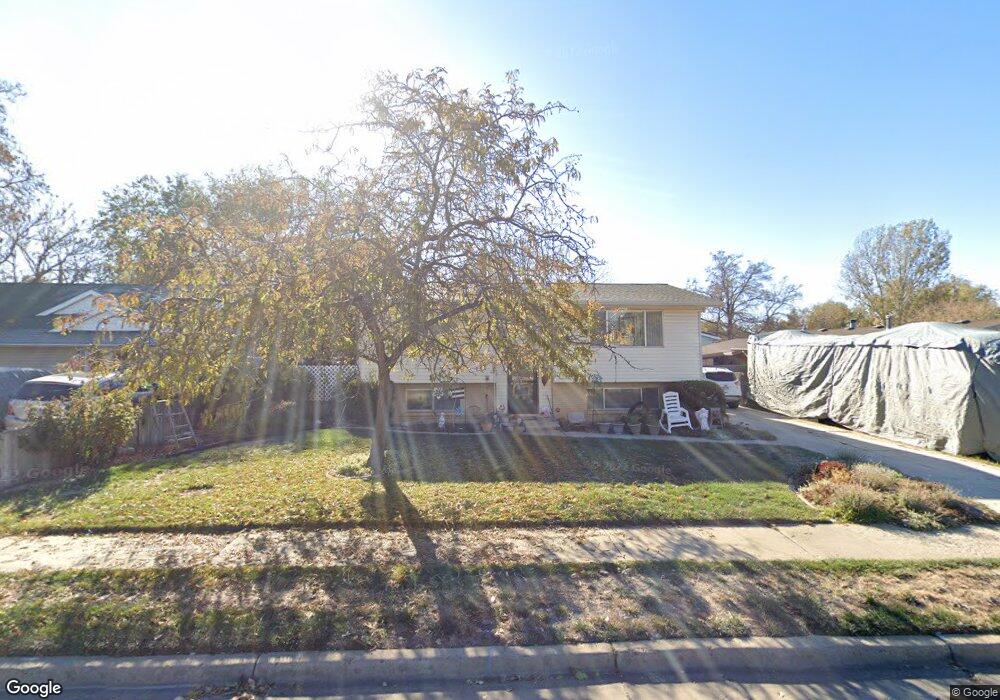
This home is located at 2523 W 6000 S, Roy, UT 84067 and is currently estimated at $385,596, approximately $201 per square foot. 2523 W 6000 S is a home located in Weber County with nearby schools including Municipal School, Roy Junior High School, and Roy High School.
Ownership History
Date
Name
Owned For
Owner Type
Purchase Details
Closed on
May 16, 2023
Sold by
Betty Ryan Investment Trust
Bought by
Colin Laura and Moreno Ramiro
Current Estimated Value
Home Financials for this Owner
Home Financials are based on the most recent Mortgage that was taken out on this home.
Original Mortgage
$348,471
Outstanding Balance
$338,586
Interest Rate
6.28%
Mortgage Type
FHA
Estimated Equity
$47,010
Purchase Details
Closed on
Apr 25, 2023
Sold by
Ryan Betty Jane and Larson Jennifer R
Bought by
Betty Ryan Investment Trust and Larson
Home Financials for this Owner
Home Financials are based on the most recent Mortgage that was taken out on this home.
Original Mortgage
$348,471
Outstanding Balance
$338,586
Interest Rate
6.28%
Mortgage Type
FHA
Estimated Equity
$47,010
Purchase Details
Closed on
Dec 15, 2022
Sold by
Ryan Betty Jane
Bought by
Ryan Betty Jane and Larson Jennifer R
Create a Home Valuation Report for This Property
The Home Valuation Report is an in-depth analysis detailing your home's value as well as a comparison with similar homes in the area
Home Values in the Area
Average Home Value in this Area
Purchase History
| Date | Buyer | Sale Price | Title Company |
|---|---|---|---|
| Colin Laura | -- | Hickman Land Title | |
| Betty Ryan Investment Trust | -- | None Listed On Document | |
| Ryan Betty Jane | -- | Land Title |
Source: Public Records
Mortgage History
| Date | Status | Borrower | Loan Amount |
|---|---|---|---|
| Open | Colin Laura | $348,471 |
Source: Public Records
Tax History
| Year | Tax Paid | Tax Assessment Tax Assessment Total Assessment is a certain percentage of the fair market value that is determined by local assessors to be the total taxable value of land and additions on the property. | Land | Improvement |
|---|---|---|---|---|
| 2025 | $2,428 | $381,520 | $111,624 | $269,896 |
| 2024 | $2,234 | $193,049 | $61,393 | $131,656 |
| 2023 | $1,987 | $169,951 | $61,254 | $108,697 |
| 2022 | $2,059 | $182,600 | $53,715 | $128,885 |
| 2021 | $1,671 | $242,000 | $69,752 | $172,248 |
| 2020 | $1,610 | $215,000 | $69,752 | $145,248 |
| 2019 | $1,512 | $189,000 | $41,828 | $147,172 |
| 2018 | $1,381 | $161,000 | $37,202 | $123,798 |
| 2017 | $1,384 | $152,000 | $37,050 | $114,950 |
| 2016 | $1,275 | $74,664 | $16,499 | $58,165 |
| 2015 | $1,240 | $74,664 | $16,499 | $58,165 |
| 2014 | $1,251 | $74,664 | $16,499 | $58,165 |
Source: Public Records
Map
Nearby Homes
Your Personal Tour Guide
Ask me questions while you tour the home.