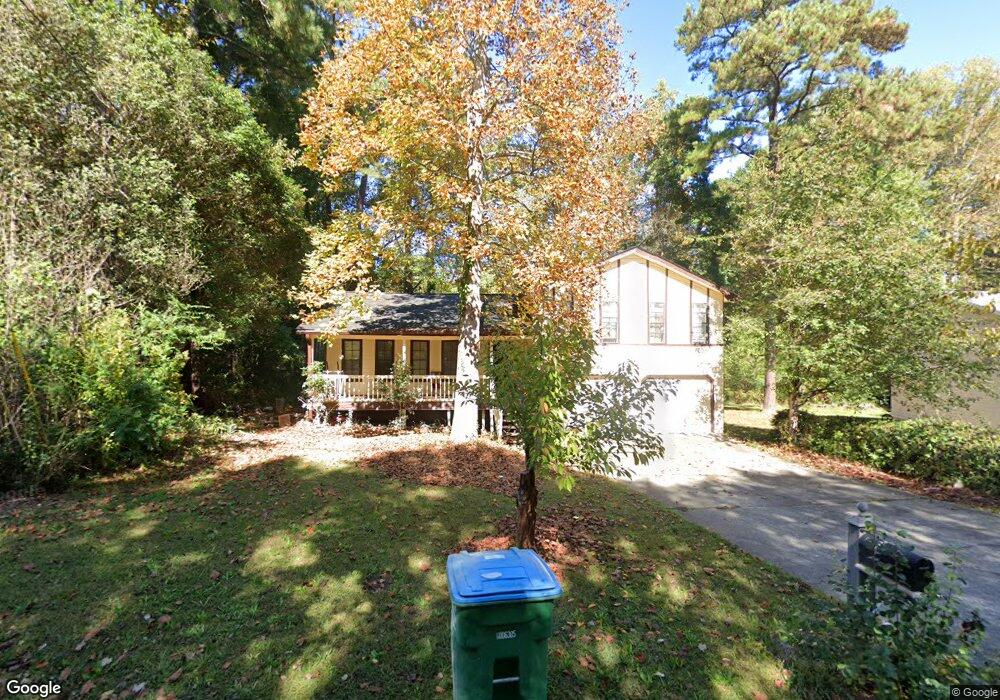
2523 Wagon Trace Duluth, GA 30096
Estimated Value: $329,000 - $420,000
3
Beds
2
Baths
1,912
Sq Ft
$198/Sq Ft
Est. Value
About This Home
This home is located at 2523 Wagon Trace, Duluth, GA 30096 and is currently estimated at $379,390, approximately $198 per square foot. 2523 Wagon Trace is a home located in Gwinnett County with nearby schools including Berkeley Lake Elementary School, Duluth Middle School, and Duluth High School.
Ownership History
Date
Name
Owned For
Owner Type
Purchase Details
Closed on
Dec 19, 2025
Sold by
Gao Yun
Bought by
Liu Gary D
Current Estimated Value
Purchase Details
Closed on
Aug 18, 2010
Sold by
Us Bank Na Gsaa 2005-11
Bought by
Liu Donglei and Gao Yun
Purchase Details
Closed on
May 4, 2010
Sold by
Creasy Jenny P
Bought by
Gsaa 2005-11
Purchase Details
Closed on
Mar 18, 2005
Sold by
Creasy Jenny P
Bought by
Creasy Chad E and Creasy Jenny
Home Financials for this Owner
Home Financials are based on the most recent Mortgage that was taken out on this home.
Original Mortgage
$108,800
Interest Rate
5.75%
Mortgage Type
New Conventional
Purchase Details
Closed on
Jun 28, 1999
Sold by
Aghaie Houshang and Aghaie Wanda
Bought by
Roy Nicole E
Home Financials for this Owner
Home Financials are based on the most recent Mortgage that was taken out on this home.
Original Mortgage
$90,000
Interest Rate
7.23%
Mortgage Type
New Conventional
Create a Home Valuation Report for This Property
The Home Valuation Report is an in-depth analysis detailing your home's value as well as a comparison with similar homes in the area
Home Values in the Area
Average Home Value in this Area
Purchase History
| Date | Buyer | Sale Price | Title Company |
|---|---|---|---|
| Liu Gary D | -- | -- | |
| Liu Donglei | $73,400 | -- | |
| Gsaa 2005-11 | $80,000 | -- | |
| Creasy Chad E | -- | -- | |
| Creasy Jenny P | $136,000 | -- | |
| Roy Nicole E | $120,000 | -- |
Source: Public Records
Mortgage History
| Date | Status | Borrower | Loan Amount |
|---|---|---|---|
| Previous Owner | Creasy Jenny P | $108,800 | |
| Previous Owner | Creasy Jenny P | $20,400 | |
| Previous Owner | Roy Nicole E | $90,000 |
Source: Public Records
Tax History
| Year | Tax Paid | Tax Assessment Tax Assessment Total Assessment is a certain percentage of the fair market value that is determined by local assessors to be the total taxable value of land and additions on the property. | Land | Improvement |
|---|---|---|---|---|
| 2025 | -- | $164,400 | $27,880 | $136,520 |
| 2024 | $5,243 | $137,680 | $24,000 | $113,680 |
| 2023 | $5,243 | $144,240 | $24,000 | $120,240 |
| 2022 | $5,084 | $134,200 | $22,000 | $112,200 |
| 2021 | $3,583 | $100,280 | $18,000 | $82,280 |
| 2020 | $3,583 | $90,000 | $16,000 | $74,000 |
| 2019 | $3,261 | $84,520 | $16,000 | $68,520 |
| 2018 | $2,797 | $71,240 | $14,000 | $57,240 |
| 2016 | $2,374 | $58,680 | $10,400 | $48,280 |
| 2015 | $1,830 | $42,680 | $8,000 | $34,680 |
| 2014 | $1,839 | $42,680 | $8,000 | $34,680 |
Source: Public Records
Map
Nearby Homes
- 4569 Iroquois Trail
- 4631 Leader Ln
- 3927 Centennial Trail Unit III
- 4242 Trail
- 4641 Broadwater Trail
- 4328 Buckingham Place
- 2431 Player Ct
- 2655 Cambridge Mews Dr
- 4300 Wildridge Dr
- 2207 Hopkins Terrace
- 4270 Berkeley Mill Ln
- 4110 Megan Rd Unit 2
- 4240 Berkeley Mill Ln
- 4633 Elsinore Cir
- 2852 Inverloch Cir
- 2829 Shelburne Ct
- 2835 E Mount Tabor Cir
- 2925 Landington Way
- 4091 Beaver Oaks Dr
- 2935 Landington Way
- 2515 Wagon Trace Unit 10
- 2527 Wagon Wheel Trace
- 2537 Wagon Wheel Trace
- 4464 Tee Pee Ct
- 2507 Wagon Trace
- 4475 Tee Pee Ct
- 4475 Tee Pee Ct
- 2507 Wagon Wheel Trace
- 2547 Wagon Wheel Trace
- 2516 Wagon Trace
- 2499 Wagon Trace
- 4454 Tee Pee Ct Unit 8
- 4387 Osceola Ct
- 4387 Osceola Ct
- 4465 Tee Pee Ct
- 2497 Wagon Wheel Trace Unit 10
- 4377 Osceola Ct
- 2526 Wagon Wheel Trace
- 2491 Wagon Trace Unit 2
- 2536 Wagon Wheel Trace Unit 10
Your Personal Tour Guide
Ask me questions while you tour the home.