25233 S 458 Rd Tahlequah, OK 74464
Estimated Value: $227,000 - $288,000
3
Beds
2
Baths
1,837
Sq Ft
$137/Sq Ft
Est. Value
About This Home
This home is located at 25233 S 458 Rd, Tahlequah, OK 74464 and is currently estimated at $251,863, approximately $137 per square foot. 25233 S 458 Rd is a home located in Cherokee County.
Ownership History
Date
Name
Owned For
Owner Type
Purchase Details
Closed on
Jan 13, 2016
Sold by
Johnson Lyndon J and Johnson Kristi J
Bought by
Keeton Chris and Keeton Stephanie
Current Estimated Value
Home Financials for this Owner
Home Financials are based on the most recent Mortgage that was taken out on this home.
Original Mortgage
$32,074
Interest Rate
3.94%
Mortgage Type
Purchase Money Mortgage
Purchase Details
Closed on
Jul 13, 2006
Sold by
Keim Delmer L and Kim Peggy Jo
Bought by
Johnson Lyndon J and Johnson Kristi J
Home Financials for this Owner
Home Financials are based on the most recent Mortgage that was taken out on this home.
Original Mortgage
$10,552
Interest Rate
6.67%
Mortgage Type
Purchase Money Mortgage
Purchase Details
Closed on
Jun 17, 1998
Sold by
F M and Nancy Schubert
Bought by
Lyndon and Kristi Johnson
Create a Home Valuation Report for This Property
The Home Valuation Report is an in-depth analysis detailing your home's value as well as a comparison with similar homes in the area
Home Values in the Area
Average Home Value in this Area
Purchase History
| Date | Buyer | Sale Price | Title Company |
|---|---|---|---|
| Keeton Chris | $30,000 | None Available | |
| Johnson Lyndon J | $12,000 | Tahlequah Abstract Closing S | |
| Lyndon | $9,500 | -- |
Source: Public Records
Mortgage History
| Date | Status | Borrower | Loan Amount |
|---|---|---|---|
| Closed | Keeton Chris | $32,074 | |
| Previous Owner | Johnson Lyndon J | $10,552 |
Source: Public Records
Tax History Compared to Growth
Tax History
| Year | Tax Paid | Tax Assessment Tax Assessment Total Assessment is a certain percentage of the fair market value that is determined by local assessors to be the total taxable value of land and additions on the property. | Land | Improvement |
|---|---|---|---|---|
| 2025 | $764 | $10,923 | $813 | $10,110 |
| 2024 | $764 | $10,604 | $789 | $9,815 |
| 2023 | $764 | $10,296 | $765 | $9,531 |
| 2022 | $729 | $9,996 | $741 | $9,255 |
| 2021 | $709 | $9,705 | $718 | $8,987 |
| 2020 | $701 | $9,422 | $695 | $8,727 |
| 2019 | $674 | $9,148 | $675 | $8,473 |
| 2018 | $661 | $8,881 | $655 | $8,226 |
| 2017 | $646 | $8,622 | $636 | $7,986 |
| 2016 | $623 | $8,372 | $1,775 | $6,597 |
| 2015 | $594 | $8,128 | $637 | $7,491 |
| 2014 | $574 | $7,891 | $635 | $7,256 |
Source: Public Records
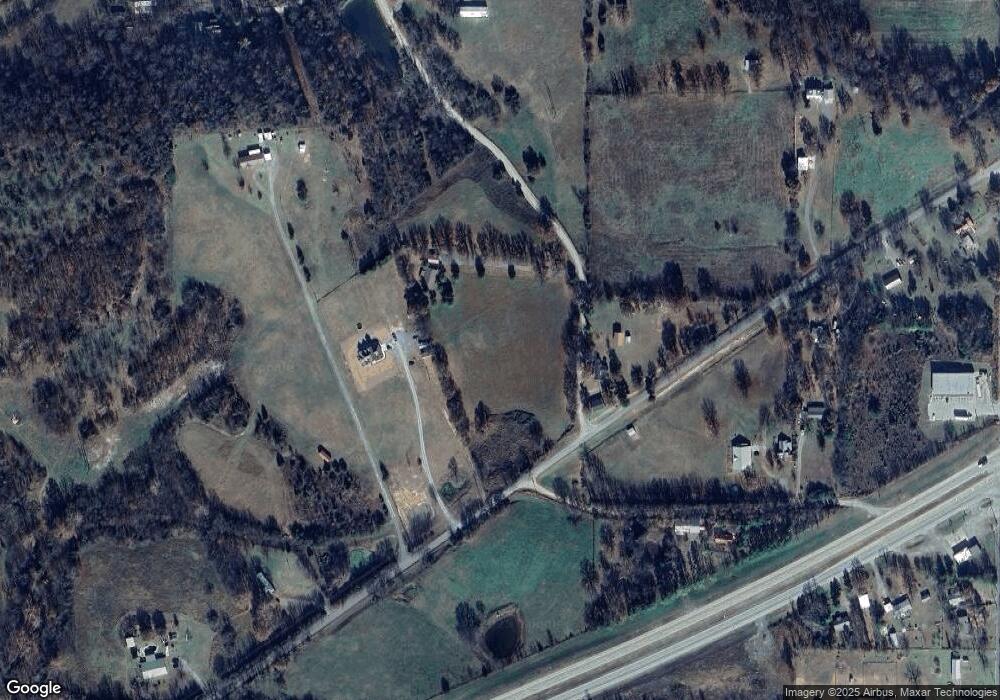
Map
Nearby Homes
- 0 Hwy 62 Hwy Unit 2532149
- 0 Hwy 62 Hwy Unit 2532139
- 0 Hwy 62 Hwy Unit 2532141
- 0 Hwy 62 Hwy Unit 2532145
- 12890 W Southern Oaks St
- 12910 W Southern Oaks St
- 12219 U S 62
- 13670 W 834 Rd
- 11396 W Joyce Ln
- 24481 S Manard Rd
- 14650 W 835 Rd
- 1956 E Moffett Ln
- 27254 S 490 Rd
- 175 Reid Rd
- 121 Quanah Rd
- 0 S Qualls Rd Unit 2543872
- 1904 N County Line Rd E
- 22695 N 6 Mile Rd
- 2 S 490 Rd
- 0 S 490 Rd
- 12700 W 835 Rd
- 0 S 458 Rd Unit 2313104
- 0 S 458 Rd Unit 1541508
- 12770 W 835 Rd
- 12642 W 835 Rd
- 25230 S 458 Rd
- 25061 S 458 Rd
- 12600 W 835 Rd
- 12807 Country Ln
- 12842 Country Ln
- 25042 S 458 Rd
- 12911 W 835 Rd
- 12840 Country Ln
- 12844 Country Ln
- 12522 W 835 Rd
- 0 Hwy 62 Hwy Unit 2543791
- 0 Hwy 62 Hwy Unit 2517481
- 0 Hwy 62 Hwy Unit 2443573
- 0 Hwy 62 Hwy Unit 2443577
- 0 Hwy 62 Hwy Unit 2443579