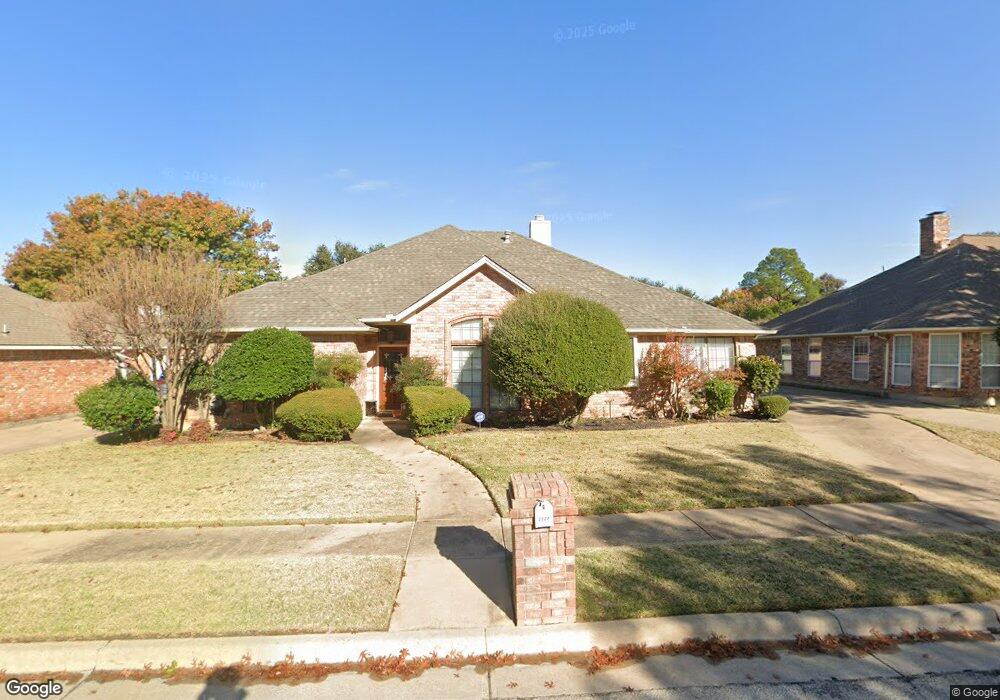
2524 Fox Glenn Cir Bedford, TX 76021
Estimated Value: $552,000 - $564,628
4
Beds
3
Baths
2,610
Sq Ft
$213/Sq Ft
Est. Value
About This Home
This home is located at 2524 Fox Glenn Cir, Bedford, TX 76021 and is currently estimated at $556,407, approximately $213 per square foot. 2524 Fox Glenn Cir is a home located in Tarrant County with nearby schools including Spring Garden Elementary School, Harwood Junior High School, and Trinity High School.
Ownership History
Date
Name
Owned For
Owner Type
Purchase Details
Closed on
Apr 23, 2003
Sold by
Andrews Jerry and Andrews Ronda Baker
Bought by
Lucio Lupe
Current Estimated Value
Home Financials for this Owner
Home Financials are based on the most recent Mortgage that was taken out on this home.
Original Mortgage
$165,600
Outstanding Balance
$71,767
Interest Rate
5.87%
Mortgage Type
Purchase Money Mortgage
Estimated Equity
$484,640
Purchase Details
Closed on
Mar 29, 2001
Sold by
Hansen Richard Carl and Owens Hansen Gerri
Bought by
Andrews Jerry and Baker Ronda
Home Financials for this Owner
Home Financials are based on the most recent Mortgage that was taken out on this home.
Original Mortgage
$185,250
Interest Rate
6.75%
Purchase Details
Closed on
Jul 14, 1999
Sold by
Hansen Diane E
Bought by
Hansen Richard Carl
Create a Home Valuation Report for This Property
The Home Valuation Report is an in-depth analysis detailing your home's value as well as a comparison with similar homes in the area
Home Values in the Area
Average Home Value in this Area
Purchase History
| Date | Buyer | Sale Price | Title Company |
|---|---|---|---|
| Lucio Lupe | -- | Alamo Title Company | |
| Andrews Jerry | -- | American Title Co | |
| Hansen Richard Carl | -- | -- |
Source: Public Records
Mortgage History
| Date | Status | Borrower | Loan Amount |
|---|---|---|---|
| Open | Lucio Lupe | $165,600 | |
| Previous Owner | Andrews Jerry | $185,250 |
Source: Public Records
Tax History Compared to Growth
Tax History
| Year | Tax Paid | Tax Assessment Tax Assessment Total Assessment is a certain percentage of the fair market value that is determined by local assessors to be the total taxable value of land and additions on the property. | Land | Improvement |
|---|---|---|---|---|
| 2025 | $7,526 | $551,511 | $100,000 | $451,511 |
| 2024 | $7,526 | $551,511 | $100,000 | $451,511 |
| 2023 | $8,675 | $498,610 | $65,000 | $433,610 |
| 2022 | $8,980 | $468,937 | $65,000 | $403,937 |
| 2021 | $8,805 | $378,210 | $65,000 | $313,210 |
| 2020 | $8,079 | $339,805 | $65,000 | $274,805 |
| 2019 | $8,465 | $359,381 | $65,000 | $294,381 |
| 2018 | $7,313 | $316,757 | $65,000 | $251,757 |
| 2017 | $6,966 | $298,336 | $30,000 | $268,336 |
| 2016 | $6,333 | $261,783 | $30,000 | $231,783 |
| 2015 | $5,975 | $248,900 | $30,000 | $218,900 |
| 2014 | $5,975 | $248,900 | $30,000 | $218,900 |
Source: Public Records
Map
Nearby Homes
- 3721 Fieldcrest Ln
- 2209 Laurel Ct
- 3840 Edgewater Dr
- Seaberry II Plan at Grace Park - Signature Series
- Primrose FE V Plan at Grace Park - Signature Series
- Hawthorne Plan at Grace Park - Signature Series
- Seaberry Plan at Grace Park - Signature Series
- Gardenia Plan at Grace Park - Signature Series
- Bellflower IV Plan at Grace Park - Signature Series
- Bellflower II Plan at Grace Park - Signature Series
- Carolina IV Plan at Grace Park - Signature Series
- Carolina Plan at Grace Park - Signature Series
- Violet III Plan at Grace Park - Signature Series
- Violet IV Plan at Grace Park - Signature Series
- Magnolia III Plan at Grace Park - Signature Series
- Violet II Plan at Grace Park - Signature Series
- Rose II Plan at Grace Park - Signature Series
- Magnolia II Plan at Grace Park - Signature Series
- Magnolia Plan at Grace Park - Signature Series
- Hawthorne II Plan at Grace Park - Signature Series
- 2528 Fox Glenn Cir
- 2520 Fox Glenn Cir
- 2400 Woodfield Way
- 2316 Woodfield Way
- 2532 Fox Glenn Cir
- 2516 Fox Glenn Cir
- 2404 Woodfield Way
- 2312 Woodfield Way
- 2525 Fox Glenn Cir
- 2521 Fox Glenn Cir
- 2512 Fox Glenn Cir
- 2408 Woodfield Way
- 2533 Fox Glenn Cir
- 2517 Fox Glenn Cir
- 2308 Woodfield Way
- 3701 Westview Dr
- 2508 Fox Glenn Cir
- 2537 Fox Glenn Cir
- 2513 Fox Glenn Cir
- 2540 Fox Glenn Cir