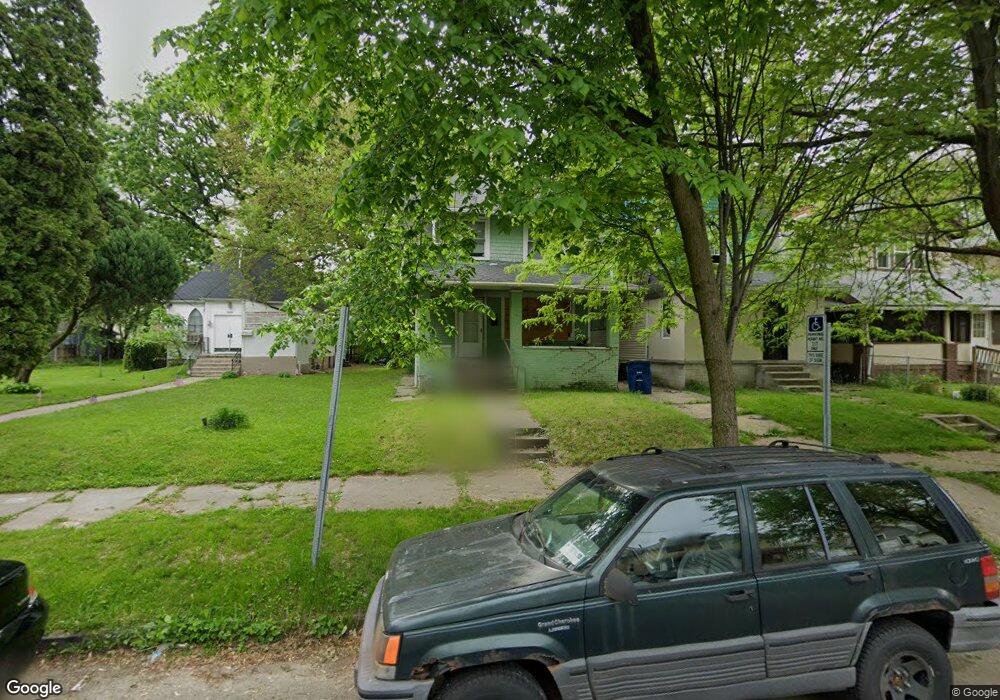
2524 Lawrence Ave Toledo, OH 43610
Downtown Toledo NeighborhoodEstimated Value: $61,513 - $73,000
3
Beds
1
Bath
1,344
Sq Ft
$51/Sq Ft
Est. Value
About This Home
This home is located at 2524 Lawrence Ave, Toledo, OH 43610 and is currently estimated at $68,128, approximately $50 per square foot. 2524 Lawrence Ave is a home located in Lucas County with nearby schools including Glenwood Elementary School, Jesup W. Scott High School, and Rosary Cathedral School.
Ownership History
Date
Name
Owned For
Owner Type
Purchase Details
Closed on
May 6, 2022
Sold by
R Bell Investments Llc
Bought by
Williams Jerome F
Current Estimated Value
Purchase Details
Closed on
Aug 15, 2018
Sold by
Bell Rashawn and Bell Rashawn T
Bought by
R Bell Investments Llc
Purchase Details
Closed on
Sep 4, 2015
Sold by
Foster Fabian S
Bought by
Bell Rashawn
Purchase Details
Closed on
Aug 21, 2015
Sold by
Overton Imari and Overton Iniari
Bought by
Foster Fabian S
Purchase Details
Closed on
Feb 20, 2013
Sold by
Nino Larry
Bought by
Foster & Foster Investments Llc
Purchase Details
Closed on
Jan 27, 2012
Sold by
Ninos Property Management Contruction
Bought by
Nino Larry
Purchase Details
Closed on
Aug 10, 2010
Sold by
Nino Monica
Bought by
Ninos Property Mgmt Construction & Sales
Purchase Details
Closed on
Jul 18, 2007
Sold by
Spivey Robert
Bought by
Nino Monica
Purchase Details
Closed on
Dec 4, 2003
Sold by
Burnes Mary L
Bought by
Spivey Robert
Create a Home Valuation Report for This Property
The Home Valuation Report is an in-depth analysis detailing your home's value as well as a comparison with similar homes in the area
Home Values in the Area
Average Home Value in this Area
Purchase History
| Date | Buyer | Sale Price | Title Company |
|---|---|---|---|
| Williams Jerome F | $300 | Hart James R | |
| R Bell Investments Llc | -- | None Available | |
| Bell Rashawn | $1,500 | None Available | |
| Foster Fabian S | $1,000 | None Available | |
| Foster & Foster Investments Llc | $500 | None Available | |
| Nino Larry | -- | Attorney | |
| Ninos Property Mgmt Construction & Sales | -- | Attorney | |
| Nino Monica | $65,000 | None Available | |
| Spivey Robert | $5,000 | -- |
Source: Public Records
Tax History Compared to Growth
Tax History
| Year | Tax Paid | Tax Assessment Tax Assessment Total Assessment is a certain percentage of the fair market value that is determined by local assessors to be the total taxable value of land and additions on the property. | Land | Improvement |
|---|---|---|---|---|
| 2024 | $4,195 | $15,855 | $2,170 | $13,685 |
| 2023 | $639 | $9,485 | $4,095 | $5,390 |
| 2022 | $758 | $9,485 | $4,095 | $5,390 |
| 2021 | $669 | $9,485 | $4,095 | $5,390 |
| 2020 | $633 | $7,805 | $3,360 | $4,445 |
| 2019 | $614 | $7,805 | $3,360 | $4,445 |
| 2018 | $587 | $7,805 | $3,360 | $4,445 |
| 2017 | $1,201 | $6,580 | $2,835 | $3,745 |
| 2016 | $3,074 | $18,800 | $8,100 | $10,700 |
| 2015 | $557 | $18,800 | $8,100 | $10,700 |
| 2014 | $639 | $6,590 | $2,840 | $3,750 |
| 2013 | $426 | $6,590 | $2,840 | $3,750 |
Source: Public Records
Map
Nearby Homes
- 2542 Maplewood Ave
- 922 Islington St
- 928 Islington St
- 952 Post St
- 2434 Lawrence Ave
- 2465 Lawton Ave
- 2368 Hollywood Ave
- 2368 Maplewood Ave
- 811 Collins St
- 2360 Maplewood Ave
- 2720 Albion St
- 2740 Robinwood Ave
- 2535 Parkwood Ave
- 2631 Parkwood Ave
- 2840 Scottwood Ave
- 630 Acklin Ave
- 2267 Robinwood Ave
- 3024 N Detroit Ave
- 2241 Whitney Ave
- 2618 Collingwood Blvd
- 2522 Lawrence Ave
- 2518 Lawrence Ave
- 2532 Lawrence Ave
- 2516 Lawrence Ave
- 2536 Lawrence Ave
- 2514 Lawrence Ave
- 2525 Maplewood Ave
- 2529 Maplewood Ave
- 2519 Maplewood Ave
- 2510 Lawrence Ave
- 2540 Lawrence Ave
- 2535 Maplewood Ave
- 2515 Maplewood Ave
- 2527 Lawrence Ave
- 2523 Lawrence Ave
- 2531 Lawrence Ave
- 2525 Lawrence Ave
- 2537 Maplewood Ave
- 2543 Maplewood Ave
- 2513 Lawrence Ave