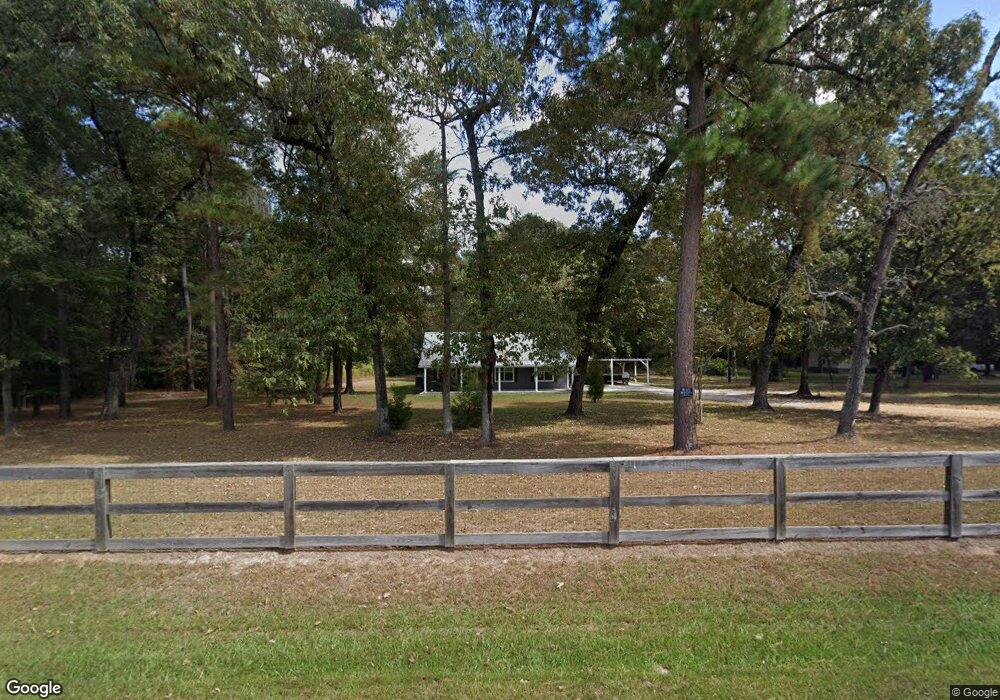
25240 Rolling Hills Dr Hockley, TX 77447
Estimated Value: $342,000 - $431,125
4
Beds
3
Baths
2,100
Sq Ft
$183/Sq Ft
Est. Value
About This Home
This home is located at 25240 Rolling Hills Dr, Hockley, TX 77447 and is currently estimated at $384,281, approximately $182 per square foot. 25240 Rolling Hills Dr is a home located in Waller County with nearby schools including Fields Store Elementary School, Schultz Junior High School, and Waller High School.
Ownership History
Date
Name
Owned For
Owner Type
Purchase Details
Closed on
Feb 14, 2019
Sold by
Greenstein Edward Allen and Greenstein Diana Lynn
Bought by
Greenstein Edward Allen and Greenstein Diana Lynn
Current Estimated Value
Purchase Details
Closed on
Nov 25, 2014
Sold by
Eidson Joseph C and Eidson Terri E
Bought by
Greenstein Edward Allen and Greenstein Diana Lynn
Purchase Details
Closed on
Jan 30, 2008
Sold by
Castle Heather and Hamilton Lisa M
Bought by
Eidson Joseph C and Eidson Terri E
Purchase Details
Closed on
Aug 23, 2005
Sold by
Stanley Development Company
Bought by
Gilley David L
Home Financials for this Owner
Home Financials are based on the most recent Mortgage that was taken out on this home.
Original Mortgage
$34,000
Interest Rate
5.78%
Create a Home Valuation Report for This Property
The Home Valuation Report is an in-depth analysis detailing your home's value as well as a comparison with similar homes in the area
Home Values in the Area
Average Home Value in this Area
Purchase History
| Date | Buyer | Sale Price | Title Company |
|---|---|---|---|
| Greenstein Edward Allen | -- | None Available | |
| Greenstein Edward Allen | -- | Declaration Title | |
| Eidson Joseph C | -- | None Available | |
| Gilley David L | -- | None Available |
Source: Public Records
Mortgage History
| Date | Status | Borrower | Loan Amount |
|---|---|---|---|
| Previous Owner | Gilley David L | $34,000 | |
| Closed | Eidson Joseph C | $0 |
Source: Public Records
Tax History Compared to Growth
Tax History
| Year | Tax Paid | Tax Assessment Tax Assessment Total Assessment is a certain percentage of the fair market value that is determined by local assessors to be the total taxable value of land and additions on the property. | Land | Improvement |
|---|---|---|---|---|
| 2025 | $258 | $310,230 | $99,000 | $211,230 |
| 2024 | $258 | $286,482 | -- | -- |
| 2023 | $258 | $260,432 | $0 | $0 |
| 2022 | $1,761 | $237,186 | -- | -- |
| 2021 | $4,495 | $245,870 | $78,300 | $167,570 |
| 2020 | $4,180 | $210,690 | $78,300 | $132,390 |
| 2019 | $3,938 | $202,920 | $64,800 | $138,120 |
| 2018 | $3,469 | $160,820 | $43,650 | $117,170 |
| 2017 | $3,385 | $155,750 | $43,650 | $112,100 |
| 2016 | $3,449 | $158,700 | $49,500 | $109,200 |
| 2015 | $898 | $740 | $0 | $740 |
| 2014 | $898 | $750 | $0 | $750 |
Source: Public Records
Map
Nearby Homes
- 25003 Joseph Rd
- 26501 Red Clover Dr
- 25927 Chicory Dr
- 290 Greenbriar Dr
- 24290 Deerbrook Dr
- 378 Ridgewood Dr
- 23128 Shakespeare Dr
- 26603 Ezemily Dr
- 27055 Sandy Creek Dr
- 26077 Forestcrest Ct
- 21138 Titian Dr
- 23442 Hillcrest Dr
- 114 Oak Hills Ct
- 149 Cedar Ct
- 169 Woodway Dr
- 126 Oak Hills Ct
- 23015 Bellini Dr
- 24433 Fm 1488 Rd
- 25106 Dickens Dr
- 26047 Allan Poe Dr
- 25230 Rolling Hills Dr
- 25260 Rolling Hills Dr
- 25220 Rolling Hills Dr
- 25270 Rolling Hills Dr
- 25261 Rolling Hills Dr
- 23980 Country Ln
- 24000 Country Ln
- 25221 Rolling Hills Dr
- 24040 W Country Ln
- 25200 Rolling Hills Dr
- 25280 Rolling Hills Dr
- 25300 Rolling Hills Dr
- 23900 Country Ln
- 23985 Country Ln
- 25140 Rolling Hills Dr
- 25370 Cedar Hill Dr
- 25370 Cedar Hill Dr
- 24080 Country Ln
- 24320 Bentwood Dr
- 25341 Rolling Hills Dr