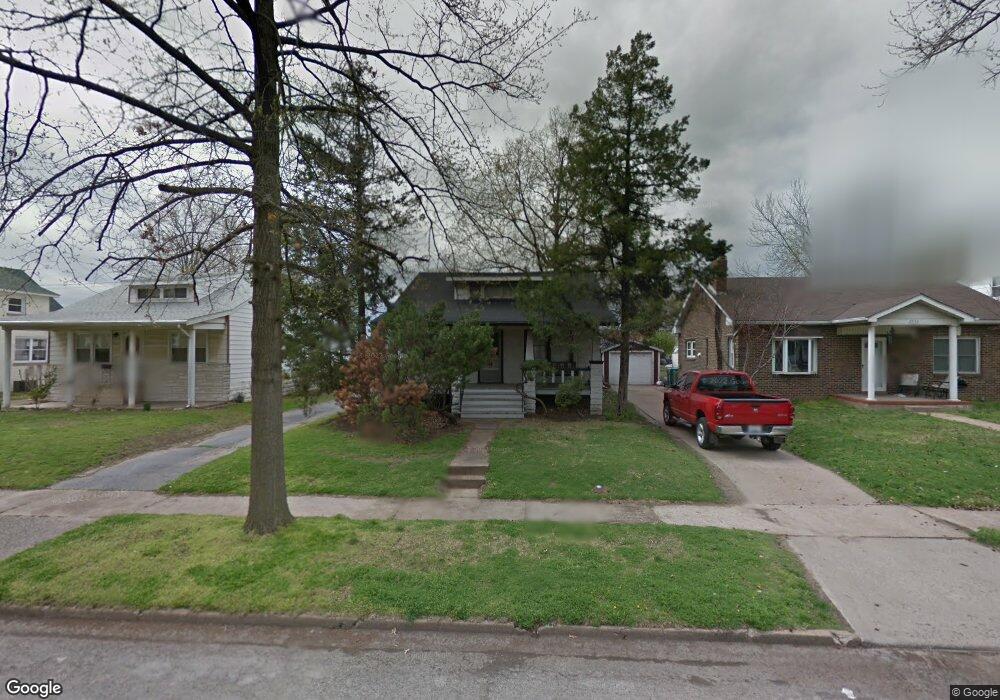
2525 Benton St Granite City, IL 62040
Estimated Value: $95,000 - $147,000
3
Beds
1
Bath
936
Sq Ft
$124/Sq Ft
Est. Value
About This Home
This home is located at 2525 Benton St, Granite City, IL 62040 and is currently estimated at $116,333, approximately $124 per square foot. 2525 Benton St is a home located in Madison County with nearby schools including Granite City High School, Metro East Montessori School, and Holy Family Catholic School.
Ownership History
Date
Name
Owned For
Owner Type
Purchase Details
Closed on
Dec 3, 2021
Sold by
American Goldfinch Preservation Trust
Bought by
1 Llc
Current Estimated Value
Home Financials for this Owner
Home Financials are based on the most recent Mortgage that was taken out on this home.
Original Mortgage
$502,342
Outstanding Balance
$243,323
Interest Rate
3.09%
Mortgage Type
New Conventional
Estimated Equity
-$126,990
Purchase Details
Closed on
Aug 24, 2020
Sold by
Allen Bernice F
Bought by
American Goldfinch Preservation Trust
Create a Home Valuation Report for This Property
The Home Valuation Report is an in-depth analysis detailing your home's value as well as a comparison with similar homes in the area
Home Values in the Area
Average Home Value in this Area
Purchase History
| Date | Buyer | Sale Price | Title Company |
|---|---|---|---|
| 1 Llc | -- | True Title Co Llc | |
| American Goldfinch Preservation Trust | $10,000 | Benchmark Title Co |
Source: Public Records
Mortgage History
| Date | Status | Borrower | Loan Amount |
|---|---|---|---|
| Open | 1 Llc | $502,342 |
Source: Public Records
Tax History Compared to Growth
Tax History
| Year | Tax Paid | Tax Assessment Tax Assessment Total Assessment is a certain percentage of the fair market value that is determined by local assessors to be the total taxable value of land and additions on the property. | Land | Improvement |
|---|---|---|---|---|
| 2024 | $3,004 | $34,470 | $3,710 | $30,760 |
| 2023 | $3,004 | $31,060 | $3,340 | $27,720 |
| 2022 | $2,958 | $28,460 | $3,060 | $25,400 |
| 2021 | $2,761 | $26,690 | $2,870 | $23,820 |
| 2020 | $2,062 | $25,490 | $2,740 | $22,750 |
| 2019 | $1,968 | $24,160 | $2,600 | $21,560 |
| 2018 | $1,356 | $23,450 | $2,520 | $20,930 |
| 2017 | $1,331 | $24,320 | $2,610 | $21,710 |
| 2016 | $1,400 | $24,320 | $2,610 | $21,710 |
| 2015 | $1,262 | $24,320 | $2,610 | $21,710 |
| 2014 | $1,262 | $24,320 | $2,610 | $21,710 |
| 2013 | $1,262 | $24,320 | $2,610 | $21,710 |
Source: Public Records
Map
Nearby Homes