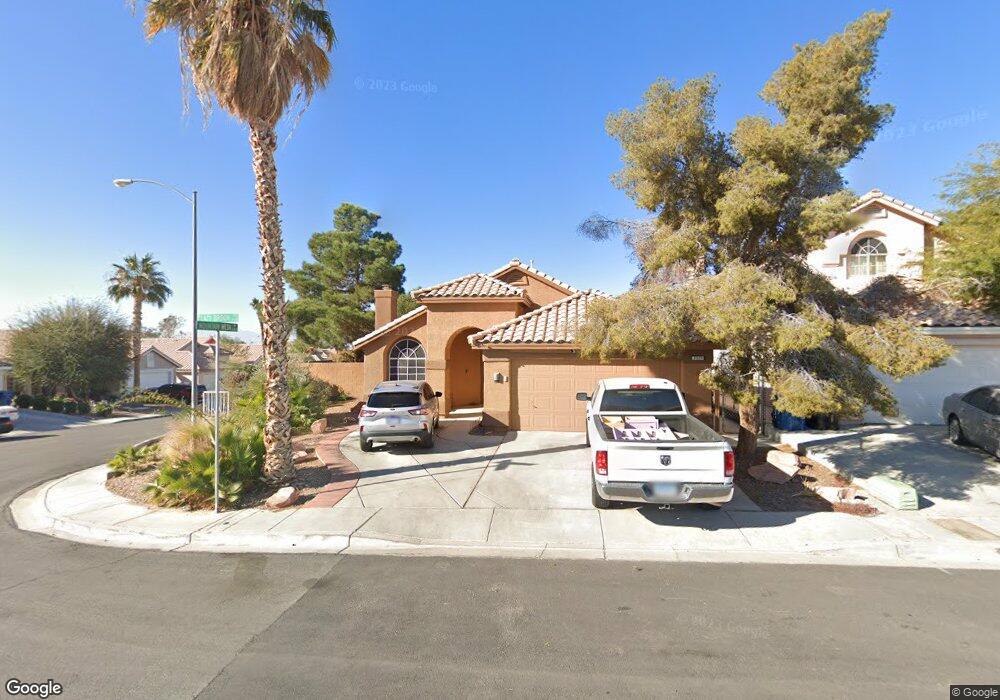
2525 Lazy Brook Dr Las Vegas, NV 89156
Estimated Value: $381,502 - $409,000
3
Beds
2
Baths
1,614
Sq Ft
$246/Sq Ft
Est. Value
About This Home
This home is located at 2525 Lazy Brook Dr, Las Vegas, NV 89156 and is currently estimated at $396,376, approximately $245 per square foot. 2525 Lazy Brook Dr is a home located in Clark County with nearby schools including Helen Herr Elementary School, Dr. William H. Bailey Middle School, and Sunrise Mountain High School.
Ownership History
Date
Name
Owned For
Owner Type
Purchase Details
Closed on
Feb 22, 2021
Sold by
Lamson Richard G and Lamson Ginger
Bought by
Dye William J and Kelly Danielle Bj
Current Estimated Value
Home Financials for this Owner
Home Financials are based on the most recent Mortgage that was taken out on this home.
Original Mortgage
$271,600
Outstanding Balance
$242,916
Interest Rate
2.7%
Mortgage Type
New Conventional
Estimated Equity
$153,460
Purchase Details
Closed on
Sep 25, 2002
Sold by
Lamson Richard G and Lamson Ginger
Bought by
Lamson Richard G and Lamson Ginger
Home Financials for this Owner
Home Financials are based on the most recent Mortgage that was taken out on this home.
Original Mortgage
$119,284
Interest Rate
6.16%
Mortgage Type
FHA
Purchase Details
Closed on
May 14, 1999
Sold by
Richardson Ching Yin
Bought by
Lamson Richard G
Home Financials for this Owner
Home Financials are based on the most recent Mortgage that was taken out on this home.
Original Mortgage
$119,121
Interest Rate
6.94%
Mortgage Type
FHA
Create a Home Valuation Report for This Property
The Home Valuation Report is an in-depth analysis detailing your home's value as well as a comparison with similar homes in the area
Home Values in the Area
Average Home Value in this Area
Purchase History
| Date | Buyer | Sale Price | Title Company |
|---|---|---|---|
| Dye William J | $284,000 | Ticor Title Las Vegas | |
| Lamson Richard G | -- | Land Title | |
| Lamson Richard G | $121,000 | Land Title |
Source: Public Records
Mortgage History
| Date | Status | Borrower | Loan Amount |
|---|---|---|---|
| Open | Dye William J | $271,600 | |
| Previous Owner | Lamson Richard G | $119,284 | |
| Previous Owner | Lamson Richard G | $119,121 |
Source: Public Records
Tax History Compared to Growth
Tax History
| Year | Tax Paid | Tax Assessment Tax Assessment Total Assessment is a certain percentage of the fair market value that is determined by local assessors to be the total taxable value of land and additions on the property. | Land | Improvement |
|---|---|---|---|---|
| 2025 | $1,258 | $83,330 | $26,950 | $56,380 |
| 2024 | $1,222 | $83,330 | $26,950 | $56,380 |
| 2023 | $997 | $82,663 | $28,700 | $53,963 |
| 2022 | $1,301 | $71,853 | $22,400 | $49,453 |
| 2021 | $1,205 | $67,490 | $20,300 | $47,190 |
| 2020 | $1,116 | $66,175 | $19,250 | $46,925 |
| 2019 | $1,083 | $63,873 | $17,500 | $46,373 |
| 2018 | $1,052 | $57,793 | $12,950 | $44,843 |
| 2017 | $1,695 | $57,796 | $12,250 | $45,546 |
| 2016 | $997 | $49,205 | $9,800 | $39,405 |
| 2015 | $994 | $44,846 | $6,300 | $38,546 |
| 2014 | $965 | $32,125 | $6,300 | $25,825 |
Source: Public Records
Map
Nearby Homes
- 6492 Silent Pine Ave
- 6452 Cedar Breaks Ave
- 6386 Cedar Breaks Ave
- 6374 Horizon Ridge Ct
- 6370 Canyon Vista Ct
- 6294 Stone Hollow Ave
- 2650 Holy Cross Dr
- 2300 Monterey Pine Dr
- 2665 Flathead Falls St
- 6733 E Carey Ave
- 6746 Magnolia River Ave
- 6718 Violet Cascade Ave
- 6749 Violet Cascade Ave
- 6724 Violet Cascade Ave
- 6782 Magnolia River Ave
- 6758 Magnolia River Ave
- 6730 Violet Cascade Ave
- 6255 Bryce Canyon Ave
- 2257 Bridle Wreath Ln
- 6736 Violet Cascade Ave
- 2533 Lazy Brook Dr
- 2533 Lazy Brook Dr
- 6464 Mountain Mesa Ave
- 2541 Lazy Brook Dr
- 6481 Mountain Mesa Ave
- 6456 Mountain Mesa Ave
- 6473 Mountain Mesa Ave
- 2524 Lazy Brook Dr
- 6489 Mountain Mesa Ave
- 2549 Lazy Brook Dr
- 2549 Lazy Brook Dr
- 2546 Windy Leaf Dr
- 6465 Mountain Mesa Ave
- 2532 Lazy Brook Dr
- 2516 Lazy Brook Dr
- 6455 Winding Ridge Way
- 6497 Mountain Mesa Ave
- 6448 Mountain Mesa Ave
- 2542 Lazy Brook Dr
- 6457 Mountain Mesa Ave