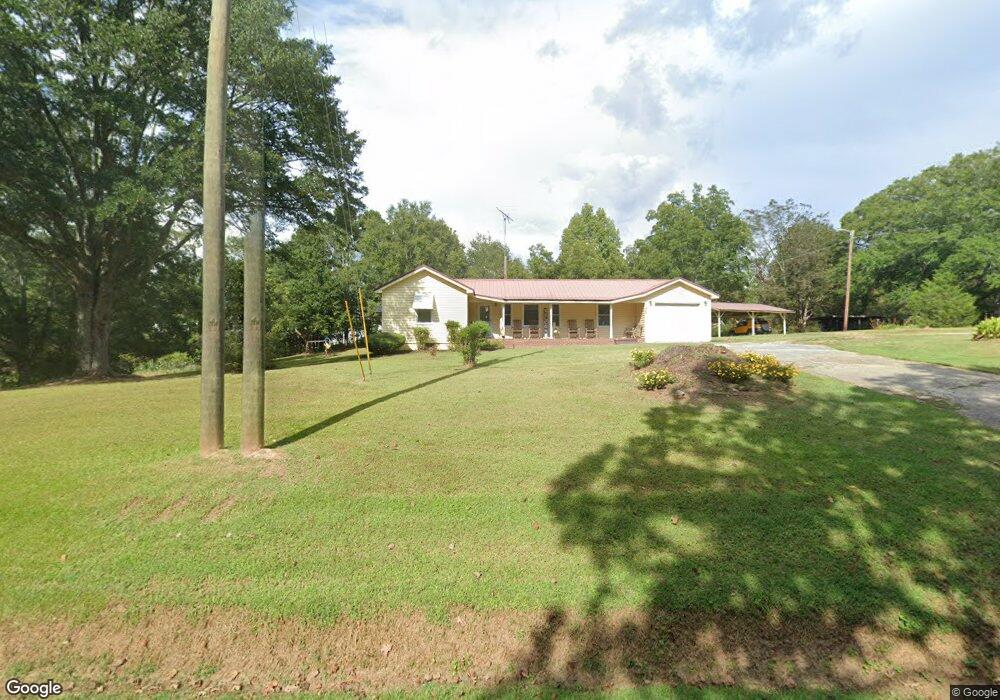
2525 Mount Zion Rd Carrollton, GA 30117
Estimated Value: $205,000 - $243,000
2
Beds
2
Baths
1,108
Sq Ft
$200/Sq Ft
Est. Value
About This Home
This home is located at 2525 Mount Zion Rd, Carrollton, GA 30117 and is currently estimated at $221,590, approximately $199 per square foot. 2525 Mount Zion Rd is a home located in Carroll County with nearby schools including Mt. Zion Elementary School, Mt. Zion Middle School, and Mt. Zion High School.
Ownership History
Date
Name
Owned For
Owner Type
Purchase Details
Closed on
Oct 16, 2006
Sold by
Smith Michael A
Bought by
Smith Michael A
Current Estimated Value
Purchase Details
Closed on
Jun 13, 2005
Sold by
Perry Mabel R
Bought by
Smith Michael A
Home Financials for this Owner
Home Financials are based on the most recent Mortgage that was taken out on this home.
Original Mortgage
$92,568
Outstanding Balance
$48,139
Interest Rate
5.7%
Mortgage Type
FHA
Estimated Equity
$173,451
Purchase Details
Closed on
Apr 23, 2004
Sold by
Perry Kenneth Etal
Bought by
Perry Mabel F Mrs
Purchase Details
Closed on
Oct 11, 2001
Sold by
Perry Mabel
Bought by
Perry Kenneth Etal
Purchase Details
Closed on
Mar 6, 1993
Bought by
Perry Mabel
Purchase Details
Closed on
Feb 10, 1993
Bought by
Perry Mabel
Purchase Details
Closed on
May 1, 1980
Bought by
Perry Mabel Frances
Create a Home Valuation Report for This Property
The Home Valuation Report is an in-depth analysis detailing your home's value as well as a comparison with similar homes in the area
Home Values in the Area
Average Home Value in this Area
Purchase History
| Date | Buyer | Sale Price | Title Company |
|---|---|---|---|
| Smith Michael A | -- | -- | |
| Smith Michael A | $93,300 | -- | |
| Perry Mabel F Mrs | -- | -- | |
| Perry Kenneth Etal | -- | -- | |
| Perry Mabel | -- | -- | |
| Perry Mabel | -- | -- | |
| Perry Mabel Frances | -- | -- |
Source: Public Records
Mortgage History
| Date | Status | Borrower | Loan Amount |
|---|---|---|---|
| Open | Smith Michael A | $92,568 |
Source: Public Records
Tax History Compared to Growth
Tax History
| Year | Tax Paid | Tax Assessment Tax Assessment Total Assessment is a certain percentage of the fair market value that is determined by local assessors to be the total taxable value of land and additions on the property. | Land | Improvement |
|---|---|---|---|---|
| 2024 | $1,000 | $54,295 | $9,000 | $45,295 |
| 2023 | $1,000 | $50,394 | $9,000 | $41,394 |
| 2022 | $781 | $36,266 | $3,013 | $33,253 |
| 2021 | $697 | $31,190 | $2,410 | $28,780 |
| 2020 | $612 | $27,847 | $2,191 | $25,656 |
| 2019 | $564 | $25,788 | $2,191 | $23,597 |
| 2018 | $523 | $23,918 | $2,191 | $21,727 |
| 2017 | $525 | $23,918 | $2,191 | $21,727 |
| 2016 | $525 | $23,918 | $2,191 | $21,727 |
| 2015 | $799 | $32,563 | $5,636 | $26,927 |
| 2014 | $802 | $32,563 | $5,636 | $26,927 |
Source: Public Records
Map
Nearby Homes
- 304 Kodiak Rd
- 1202 Mount Zion Rd
- 113 Natures Pointe Trail
- 2994 Mount Zion Rd
- 2994 Mount Zion Rd Unit 1
- 2994 Mount Zion Rd Unit 3
- 113 Richmond Dr
- 85 Eureka Church Rd Unit 152
- 190 Marvin Gray Rd
- 442 Plowshare Rd
- 101 Bonnie Lynn Ln
- 2070 Lovvorn Rd
- 33 Armstrong Dr
- 30 Joshua Way
- 10 Joshua Way
- 46 Gammon Rd
- 132 Pinnacle Way
- 2538 Mount Zion Rd
- 2512 Mount Zion Rd
- 14 Harper Rd
- 2545 Mount Zion Rd
- 220 Polar Ln
- 216 Polar Ln
- 224 Polar Ln
- 212 Polar Ln
- 2487 Mount Zion Rd
- 40 Harper Rd
- 228 Polar Ln
- 0 Polar Ln Unit 4056043
- 0 Polar Ln Unit 9074697
- 0 Polar Ln Unit 8085022
- 0 Polar Ln Unit 8085026
- 0 Polar Ln Unit 8302740
- 0 Polar Ln Unit 8302739
- 0 Polar Ln Unit 3219859
- 0 Polar Ln Unit 8284914
- 208 Polar Ln