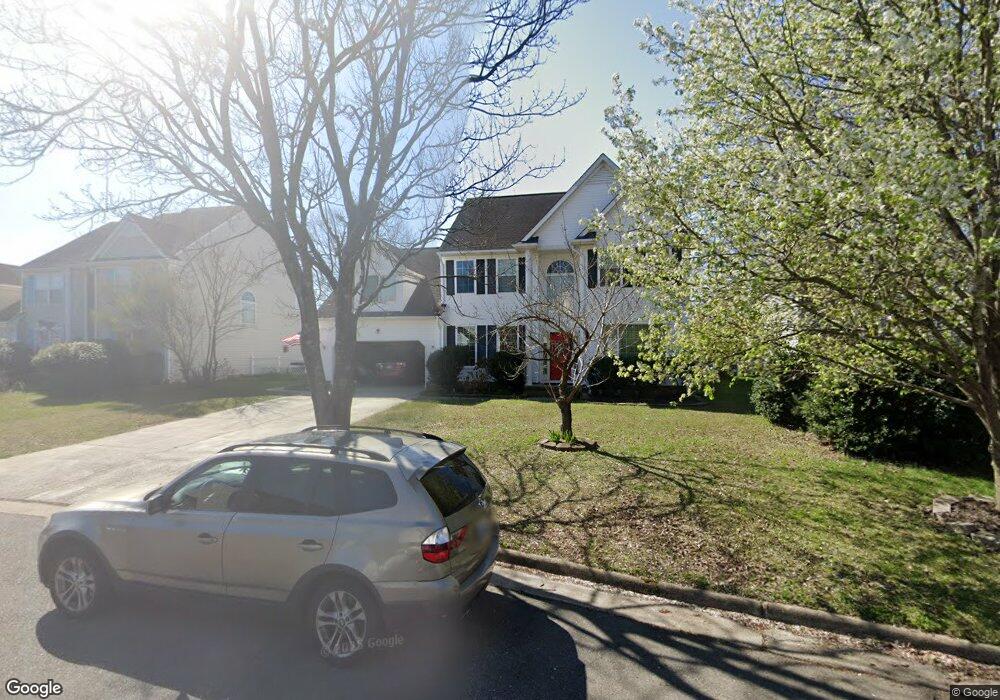
2525 Pamlico Loop Virginia Beach, VA 23456
Princess Anne NeighborhoodEstimated Value: $546,000 - $633,867
4
Beds
3
Baths
2,700
Sq Ft
$221/Sq Ft
Est. Value
About This Home
This home is located at 2525 Pamlico Loop, Virginia Beach, VA 23456 and is currently estimated at $597,467, approximately $221 per square foot. 2525 Pamlico Loop is a home located in Virginia Beach City with nearby schools including North Landing Elementary School, Landstown Middle School, and Floyd E. Kellam High School.
Ownership History
Date
Name
Owned For
Owner Type
Purchase Details
Closed on
Oct 9, 2020
Sold by
Chavez Juan and Atwood Gabriella N
Bought by
Luchko Andril and Gorokhovska Olga
Current Estimated Value
Home Financials for this Owner
Home Financials are based on the most recent Mortgage that was taken out on this home.
Original Mortgage
$220,000
Outstanding Balance
$195,678
Interest Rate
2.9%
Mortgage Type
New Conventional
Estimated Equity
$401,789
Purchase Details
Closed on
Apr 30, 2013
Sold by
Matthew Richard P
Bought by
Chavez Juan and Atwood Gabriella N
Home Financials for this Owner
Home Financials are based on the most recent Mortgage that was taken out on this home.
Original Mortgage
$330,560
Interest Rate
3.6%
Mortgage Type
VA
Purchase Details
Closed on
Aug 31, 2004
Sold by
Wolf Robert H
Bought by
Matthew Richard P
Home Financials for this Owner
Home Financials are based on the most recent Mortgage that was taken out on this home.
Original Mortgage
$333,700
Interest Rate
6.01%
Mortgage Type
New Conventional
Create a Home Valuation Report for This Property
The Home Valuation Report is an in-depth analysis detailing your home's value as well as a comparison with similar homes in the area
Home Values in the Area
Average Home Value in this Area
Purchase History
| Date | Buyer | Sale Price | Title Company |
|---|---|---|---|
| Luchko Andril | $420,000 | Accommodation | |
| Chavez Juan | $320,000 | -- | |
| Matthew Richard P | $350,000 | -- |
Source: Public Records
Mortgage History
| Date | Status | Borrower | Loan Amount |
|---|---|---|---|
| Open | Luchko Andril | $220,000 | |
| Previous Owner | Chavez Juan | $330,560 | |
| Previous Owner | Matthew Richard P | $333,700 |
Source: Public Records
Tax History
| Year | Tax Paid | Tax Assessment Tax Assessment Total Assessment is a certain percentage of the fair market value that is determined by local assessors to be the total taxable value of land and additions on the property. | Land | Improvement |
|---|---|---|---|---|
| 2025 | $5,160 | $551,800 | $215,000 | $336,800 |
| 2024 | $5,160 | $532,000 | $202,000 | $330,000 |
Source: Public Records
Map
Nearby Homes
- 2533 Pamlico Loop
- 3984 N Landing Rd
- 3000 N Landing Rd Unit 1
- 2521 Alleghany Loop
- 2525 Alleghany Loop
- 2712 Coldwell St Unit X5021
- 2609 Loudoun St
- 3225 Fayette Dr
- 3189 Barbour Dr
- 2904 Wilcox Dr
- 5+ac Indian River Rd
- 2925 Beaden Dr
- 2928 Einstein Dr
- 2888 Indian River Rd
- 2828 Garland Atwater Jr Ct
- 2809 Garland Atwater Jr Ct
- 2892 Indian River Rd
- 2789 Browning Dr
- 2821 Majestic Oak Ct
- 3403 Misty Dawn Ct
- 2529 Pamlico Loop
- 2521 Pamlico Loop
- 2517 Pamlico Loop
- 2509 Rowan Place
- 2532 Pamlico Loop
- 2513 Pamlico Loop
- 2537 Pamlico Loop
- 2541 Pamlico Loop
- 2505 Rowan Place
- 2544 Pamlico Loop
- 2728 Alameda Dr
- 2512 Rowan Place
- 2724 Alameda Dr
- 2732 Alameda Dr
- 2509 Pamlico Loop
- 2720 Alameda Dr
- 2545 Pamlico Loop
- 2736 Alameda Dr
- 2548 Pamlico Loop
- 2501 Rowan Place
Your Personal Tour Guide
Ask me questions while you tour the home.