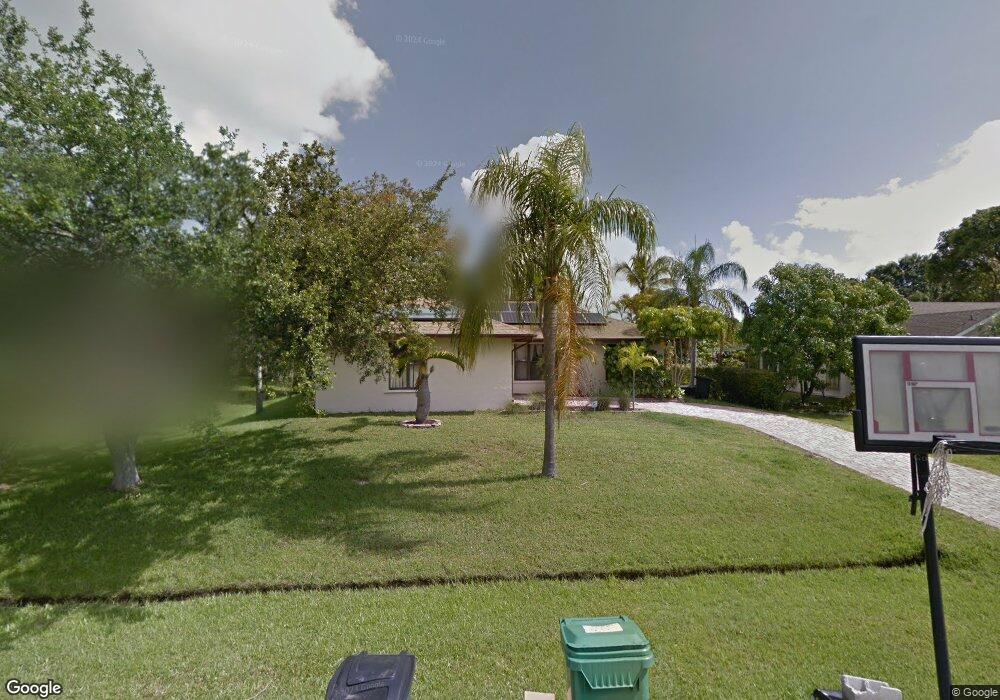
2525 SE Tiger Ave Port Saint Lucie, FL 34952
Sandhill Crossing NeighborhoodEstimated Value: $323,043 - $362,000
3
Beds
2
Baths
1,447
Sq Ft
$235/Sq Ft
Est. Value
About This Home
This home is located at 2525 SE Tiger Ave, Port Saint Lucie, FL 34952 and is currently estimated at $340,761, approximately $235 per square foot. 2525 SE Tiger Ave is a home located in St. Lucie County with nearby schools including Mariposa Elementary School, Morningside Elementary School, and Floresta Elementary School.
Ownership History
Date
Name
Owned For
Owner Type
Purchase Details
Closed on
Sep 23, 2016
Sold by
Archer Robert R and Archer Sharon M
Bought by
Guntow Kathleen
Current Estimated Value
Home Financials for this Owner
Home Financials are based on the most recent Mortgage that was taken out on this home.
Original Mortgage
$77,470
Outstanding Balance
$61,760
Interest Rate
3.37%
Mortgage Type
FHA
Estimated Equity
$279,001
Purchase Details
Closed on
May 4, 2011
Sold by
Ballard Ann G and Ballard Steven R
Bought by
Archer Robert R and Archer Sharon M
Home Financials for this Owner
Home Financials are based on the most recent Mortgage that was taken out on this home.
Original Mortgage
$72,124
Interest Rate
5.5%
Mortgage Type
FHA
Purchase Details
Closed on
Jul 29, 1998
Sold by
Pierre Yvan
Bought by
Ballard Steven R and Ballard Ann G
Home Financials for this Owner
Home Financials are based on the most recent Mortgage that was taken out on this home.
Original Mortgage
$69,360
Interest Rate
6.94%
Mortgage Type
VA
Create a Home Valuation Report for This Property
The Home Valuation Report is an in-depth analysis detailing your home's value as well as a comparison with similar homes in the area
Home Values in the Area
Average Home Value in this Area
Purchase History
| Date | Buyer | Sale Price | Title Company |
|---|---|---|---|
| Guntow Kathleen | $78,900 | Liberty Title Company Of Ame | |
| Archer Robert R | $74,000 | Down Home Title Services Inc | |
| Ballard Steven R | $68,000 | -- |
Source: Public Records
Mortgage History
| Date | Status | Borrower | Loan Amount |
|---|---|---|---|
| Open | Guntow Kathleen | $77,470 | |
| Previous Owner | Archer Robert R | $72,124 | |
| Previous Owner | Ballard Steven R | $69,360 |
Source: Public Records
Tax History Compared to Growth
Tax History
| Year | Tax Paid | Tax Assessment Tax Assessment Total Assessment is a certain percentage of the fair market value that is determined by local assessors to be the total taxable value of land and additions on the property. | Land | Improvement |
|---|---|---|---|---|
| 2024 | $2,884 | $147,240 | -- | -- |
| 2023 | $2,884 | $142,952 | $0 | $0 |
| 2022 | $2,752 | $138,789 | $0 | $0 |
| 2021 | $2,660 | $134,747 | $0 | $0 |
| 2020 | $2,654 | $132,295 | $0 | $0 |
| 2019 | $2,623 | $129,321 | $0 | $0 |
| 2018 | $2,487 | $126,910 | $0 | $0 |
| 2017 | $2,455 | $124,300 | $28,000 | $96,300 |
| 2016 | $1,175 | $107,900 | $21,600 | $86,300 |
| 2015 | $1,186 | $87,300 | $14,400 | $72,900 |
| 2014 | $1,148 | $65,651 | $0 | $0 |
Source: Public Records
Map
Nearby Homes
- 2440 SE Toledo Ave
- 2400 SE Mariposa Ave
- 2508 SE Tropical Cir E
- 2471 SE Leithgow St
- 2109 SE Trillo St
- 2449 SE Marseille St
- 2520 SE Tropical Cir E
- 2492 SE Burton St
- 2432 SE Garden Terrace Unit 703
- 2464 SE Garden Terrace Unit 605
- 2468 SE Garden Terrace Unit 501
- 2400 SE Garden Terrace Unit 101
- 2386 SE Manor Ave
- 2341 SE Mariola Ave
- 2701 SE Bishop Ave
- 2255 SE Gaslight St
- 2367 SE Manor Ave
- 2614 SE Export Ave
- 2744 SE Tropical Cir E
- 2222 SE Maize St
- 2537 SE Tiger Ave
- 2513 SE Tiger Ave
- 2252 SE Tile Terrace
- 2262 SE Tile Terrace
- 2501 SE Tiger Ave
- 2242 SE Tile Terrace
- 2530 SE Tiger Ave
- 2540 SE Tiger Ave
- 2520 SE Tiger Ave
- 2561 SE Tiger Ave
- 2510 SE Tiger Ave
- 2297 SE Short St
- 2560 SE Tiger Ave
- 2232 SE Tile Terrace
- 2285 SE Short St
- 2272 SE Dill Ln
- 2500 SE Tiger Ave
- 2573 SE Tiger Ave
- 2249 SE Tile Terrace
- 2233 SE Tile Terrace