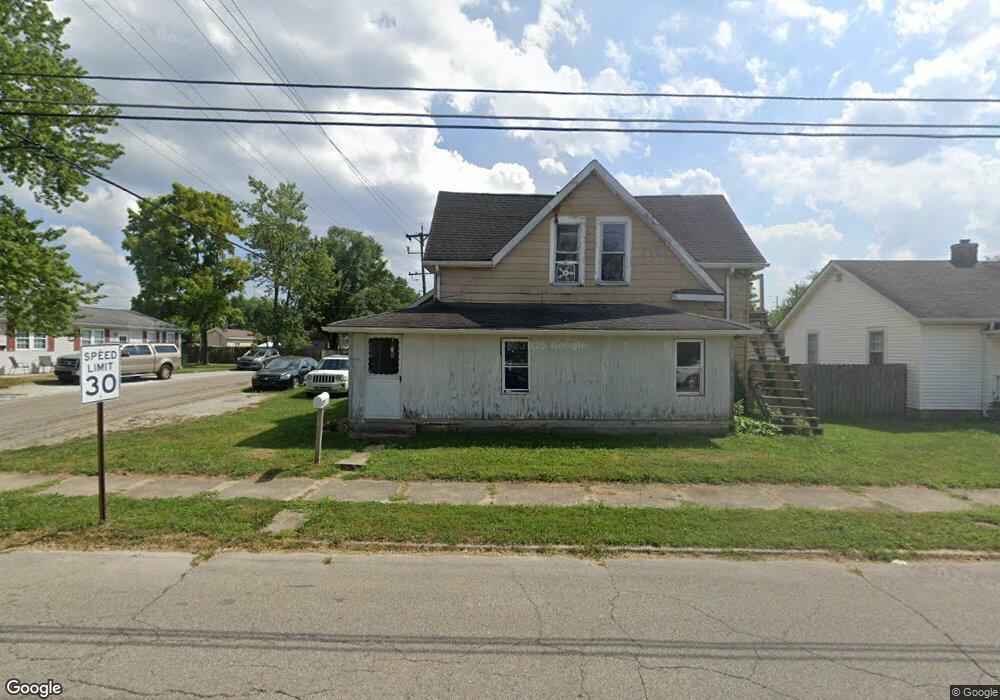
2525 Spring St New Castle, IN 47362
Estimated Value: $86,000 - $151,000
3
Beds
1
Bath
2,632
Sq Ft
$41/Sq Ft
Est. Value
About This Home
This home is located at 2525 Spring St, New Castle, IN 47362 and is currently estimated at $107,054, approximately $40 per square foot. 2525 Spring St is a home located in Henry County with nearby schools including Agape Learning Center.
Ownership History
Date
Name
Owned For
Owner Type
Purchase Details
Closed on
Nov 28, 2017
Sold by
Make Llc
Bought by
2525 Trust
Current Estimated Value
Purchase Details
Closed on
Oct 26, 2017
Sold by
Auditor
Bought by
Make Llc
Purchase Details
Closed on
Sep 21, 2012
Sold by
Citizens State Bank
Bought by
Stotler John
Purchase Details
Closed on
Sep 17, 2012
Sold by
Citizens State Bank
Bought by
Heyward Christopher and Heyward Mary A
Purchase Details
Closed on
Oct 19, 2005
Sold by
Stairhime Erma M
Bought by
Stairhime Erma M and The Erma M Stairhime Revocable
Create a Home Valuation Report for This Property
The Home Valuation Report is an in-depth analysis detailing your home's value as well as a comparison with similar homes in the area
Home Values in the Area
Average Home Value in this Area
Purchase History
| Date | Buyer | Sale Price | Title Company |
|---|---|---|---|
| 2525 Trust | $2,000 | -- | |
| 2525 Spring Street Land Trust | $2,003 | Village Real Estate Co | |
| Make Llc | $2,000 | -- | |
| Stotler John | -- | None Available | |
| Heyward Christopher | -- | None Available | |
| Stairhime Erma M | -- | None Available |
Source: Public Records
Tax History Compared to Growth
Tax History
| Year | Tax Paid | Tax Assessment Tax Assessment Total Assessment is a certain percentage of the fair market value that is determined by local assessors to be the total taxable value of land and additions on the property. | Land | Improvement |
|---|---|---|---|---|
| 2024 | $472 | $23,600 | $7,200 | $16,400 |
| 2023 | $474 | $23,700 | $7,200 | $16,500 |
| 2022 | $430 | $21,500 | $6,000 | $15,500 |
| 2021 | $422 | $21,100 | $6,000 | $15,100 |
| 2020 | $435 | $20,700 | $6,000 | $14,700 |
| 2019 | $644 | $20,400 | $6,000 | $14,400 |
| 2018 | $905 | $40,900 | $6,000 | $34,900 |
| 2017 | $898 | $40,600 | $6,000 | $34,600 |
| 2016 | $921 | $40,000 | $6,000 | $34,000 |
| 2014 | $827 | $38,300 | $6,000 | $32,300 |
| 2013 | $827 | $36,900 | $6,000 | $30,900 |
Source: Public Records
Map
Nearby Homes