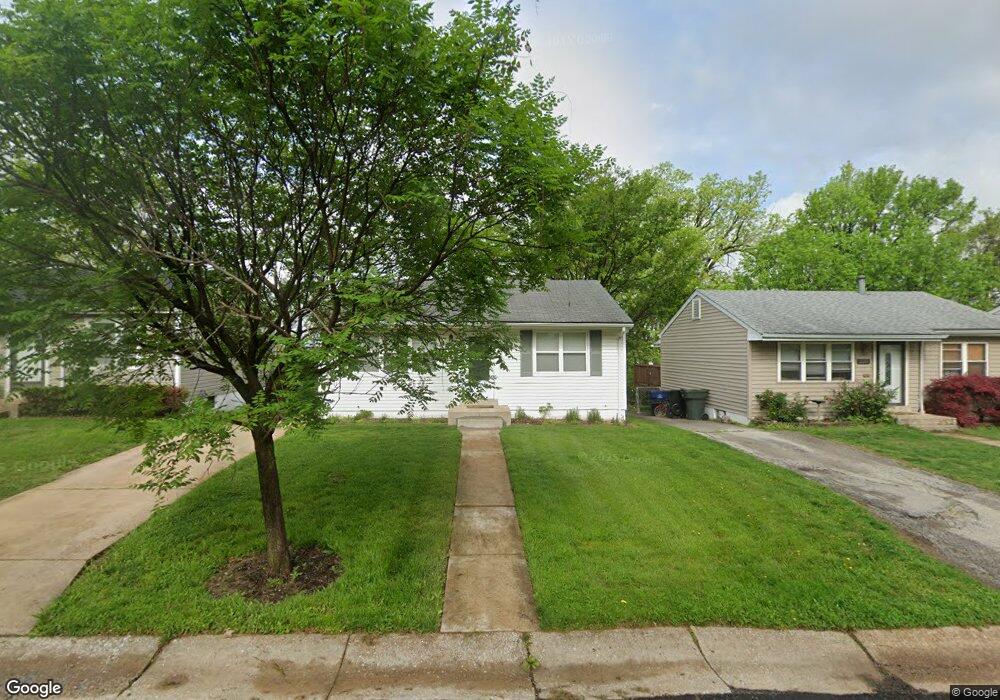
2525 Tamm Ave Saint Louis, MO 63139
Clifton Heights NeighborhoodEstimated Value: $179,000 - $197,107
2
Beds
1
Bath
1,440
Sq Ft
$131/Sq Ft
Est. Value
About This Home
This home is located at 2525 Tamm Ave, Saint Louis, MO 63139 and is currently estimated at $188,277, approximately $130 per square foot. 2525 Tamm Ave is a home located in St. Louis City with nearby schools including Mason Elementary School, Long International Middle School, and Roosevelt High School.
Ownership History
Date
Name
Owned For
Owner Type
Purchase Details
Closed on
Jul 28, 2025
Sold by
Brock Tania L
Bought by
Brock Stan
Current Estimated Value
Home Financials for this Owner
Home Financials are based on the most recent Mortgage that was taken out on this home.
Original Mortgage
$149,572
Outstanding Balance
$149,445
Interest Rate
6.81%
Mortgage Type
FHA
Estimated Equity
$38,832
Purchase Details
Closed on
Apr 30, 2014
Sold by
Mcdonald Anne
Bought by
Brock Stan and Brock Tania L
Home Financials for this Owner
Home Financials are based on the most recent Mortgage that was taken out on this home.
Original Mortgage
$108,989
Interest Rate
4.43%
Mortgage Type
FHA
Purchase Details
Closed on
Sep 10, 2013
Sold by
Raleigh Realty Llc
Bought by
Mcdonald Anne
Purchase Details
Closed on
Nov 19, 2002
Sold by
Smith Ted L and Smith Aline M
Bought by
Raleigh Realty Llc
Create a Home Valuation Report for This Property
The Home Valuation Report is an in-depth analysis detailing your home's value as well as a comparison with similar homes in the area
Home Values in the Area
Average Home Value in this Area
Purchase History
| Date | Buyer | Sale Price | Title Company |
|---|---|---|---|
| Brock Stan | -- | None Listed On Document | |
| Brock Stan | -- | None Listed On Document | |
| Brock Stan | -- | Multiple | |
| Mcdonald Anne | -- | Ust | |
| Raleigh Realty Llc | -- | -- |
Source: Public Records
Mortgage History
| Date | Status | Borrower | Loan Amount |
|---|---|---|---|
| Open | Brock Stan | $149,572 | |
| Closed | Brock Stan | $149,572 | |
| Previous Owner | Brock Stan | $108,989 |
Source: Public Records
Tax History Compared to Growth
Tax History
| Year | Tax Paid | Tax Assessment Tax Assessment Total Assessment is a certain percentage of the fair market value that is determined by local assessors to be the total taxable value of land and additions on the property. | Land | Improvement |
|---|---|---|---|---|
| 2025 | $2,225 | $31,480 | $2,450 | $29,030 |
| 2024 | $2,117 | $26,240 | $2,450 | $23,790 |
| 2023 | $2,117 | $26,240 | $2,450 | $23,790 |
| 2022 | $1,941 | $23,140 | $2,450 | $20,690 |
| 2021 | $1,938 | $23,140 | $2,450 | $20,690 |
| 2020 | $1,755 | $21,090 | $2,450 | $18,640 |
| 2019 | $1,749 | $21,090 | $2,450 | $18,640 |
| 2018 | $1,585 | $18,490 | $2,450 | $16,040 |
| 2017 | $1,558 | $18,490 | $2,450 | $16,040 |
| 2016 | $1,579 | $18,510 | $2,450 | $16,060 |
| 2015 | $1,433 | $18,510 | $2,450 | $16,060 |
| 2014 | $1,254 | $18,510 | $2,450 | $16,060 |
| 2013 | -- | $16,170 | $2,450 | $13,720 |
Source: Public Records
Map
Nearby Homes
- 6215 Columbia Ave
- 6285 Magnolia Ave
- 6541 Southwest Ave
- 6140 Columbia Ave
- 6133 Magnolia Ave
- 6537 Marmaduke Ave
- 6547 Marmaduke Ave
- 2164 Knox Ave
- 6266 Marmaduke Ave
- 6035 Elizabeth Ave
- 6445 Odell St
- 2817 Knox Ct
- 2022 Knox Ave
- 6568 Odell St
- 6020 Southwest Ave
- 6439 Arsenal St
- 2715 Watson Rd
- 6012 Odell St
- 1912 Kraft St
- 6426 Arsenal St