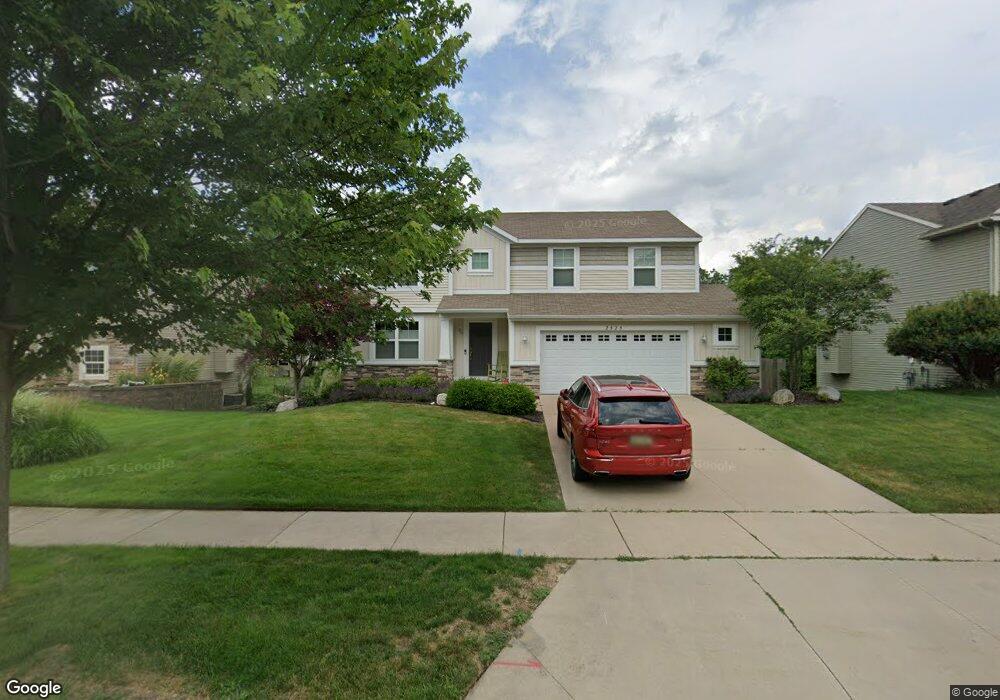
2525 Trent Ct NW Grand Rapids, MI 49504
Westside Connection NeighborhoodEstimated Value: $464,988 - $557,000
4
Beds
3
Baths
1,941
Sq Ft
$257/Sq Ft
Est. Value
About This Home
This home is located at 2525 Trent Ct NW, Grand Rapids, MI 49504 and is currently estimated at $498,997, approximately $257 per square foot. 2525 Trent Ct NW is a home located in Kent County with nearby schools including Shawmut Hills School, CA Frost Environmental Science Middle High School, and Westwood Middle School.
Ownership History
Date
Name
Owned For
Owner Type
Purchase Details
Closed on
Dec 12, 2018
Sold by
Dumez Todd and Dumez Tammy
Bought by
The Todd And Tammy Dumez Joint Trust
Current Estimated Value
Purchase Details
Closed on
Oct 12, 2016
Bought by
Dumez Todd
Home Financials for this Owner
Home Financials are based on the most recent Mortgage that was taken out on this home.
Original Mortgage
$111,920
Outstanding Balance
$89,611
Interest Rate
3.42%
Estimated Equity
$409,386
Purchase Details
Closed on
Apr 15, 2010
Sold by
Roersma & Wurn Builders Inc
Bought by
Dumez Todd and Dumez Tammy
Home Financials for this Owner
Home Financials are based on the most recent Mortgage that was taken out on this home.
Original Mortgage
$178,600
Interest Rate
5.01%
Mortgage Type
New Conventional
Purchase Details
Closed on
Feb 11, 2010
Sold by
Cherry Run Llc
Bought by
Roersma & Wurn Builders Inc
Create a Home Valuation Report for This Property
The Home Valuation Report is an in-depth analysis detailing your home's value as well as a comparison with similar homes in the area
Home Values in the Area
Average Home Value in this Area
Purchase History
| Date | Buyer | Sale Price | Title Company |
|---|---|---|---|
| The Todd And Tammy Dumez Joint Trust | -- | None Available | |
| Dumez Todd | -- | -- | |
| Dumez Todd | $188,000 | None Available | |
| Roersma & Wurn Builders Inc | $36,000 | None Available |
Source: Public Records
Mortgage History
| Date | Status | Borrower | Loan Amount |
|---|---|---|---|
| Open | Dumez Todd | $111,920 | |
| Closed | Dumez Todd | -- | |
| Previous Owner | Dumez Todd | $178,600 | |
| Closed | Roersma & Wurn Builders Inc | $0 |
Source: Public Records
Tax History Compared to Growth
Tax History
| Year | Tax Paid | Tax Assessment Tax Assessment Total Assessment is a certain percentage of the fair market value that is determined by local assessors to be the total taxable value of land and additions on the property. | Land | Improvement |
|---|---|---|---|---|
| 2025 | $2,959 | $228,200 | $0 | $0 |
| 2024 | $2,959 | $226,900 | $0 | $0 |
| 2023 | $3,002 | $196,500 | $0 | $0 |
| 2022 | $2,850 | $181,800 | $0 | $0 |
| 2021 | $2,786 | $143,000 | $0 | $0 |
| 2020 | $2,664 | $133,500 | $0 | $0 |
| 2019 | $2,790 | $122,300 | $0 | $0 |
| 2018 | $2,694 | $103,300 | $0 | $0 |
| 2017 | $2,623 | $95,900 | $0 | $0 |
| 2016 | $2,654 | $87,900 | $0 | $0 |
| 2015 | $2,469 | $87,900 | $0 | $0 |
| 2013 | -- | $72,600 | $0 | $0 |
Source: Public Records
Map
Nearby Homes
- 1907 Oakridge Ct NW
- 2505 Longmeadow St NW
- 1660 Oakleigh Rd NW
- 2530 Westbrook Dr NW
- 1853 Trillium Cir NW Unit 71
- 2343 Westwinde Dr NW
- 2220 Elmridge Dr NW
- 3080 Richmond St NW
- 1217 El Camino Dr NW
- 1270 Hillburn Ave NW Unit 35
- 1500 Hillcrest Ave NW
- 1733 Whitmore Ave NW
- 1840 Richmond St NW
- 1439 Parkhurst Ave NW
- 1355 Hillcrest Ave NW
- 1300 Lancaster Ave NW
- 1460 Benning Ave NW
- 1440 Holborn Dr NW
- 1289 Lancaster Ave NW
- 1835 Kerwin St NW
- 2517 Trent Ct NW
- 2531 Trent Ct NW
- 2531 Trent Ct NW Unit 2
- 2511 Trent Ct NW
- 1846 Cherry Run Dr NW
- 2537 Trent Ct NW
- 2526 Trent Ct NW
- 1854 Cherry Run Dr NW
- 2532 Trent Ct NW
- 2505 Trent Ct NW
- 2538 Trent Ct NW
- 2518 Trent Ct NW
- 2512 Trent Ct NW
- 2500 Trent Ct NW
- 2506 Trent Ct NW
- 1853 Cherry Run Dr NW
- 1845 Cherry Run Dr NW
- 1839 Cherry Run Dr NW
- 1833 Cherry Run Dr NW
- 1861 Cherry Run Dr NW