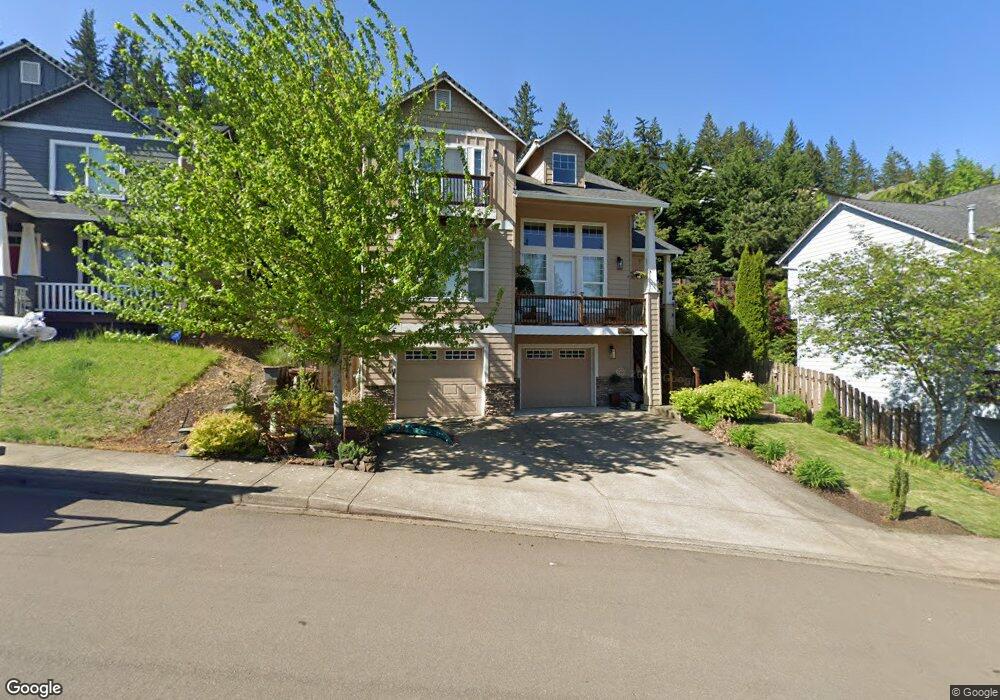
2526 48th St Washougal, WA 98671
Estimated Value: $569,125 - $609,000
3
Beds
3
Baths
2,385
Sq Ft
$247/Sq Ft
Est. Value
About This Home
This home is located at 2526 48th St, Washougal, WA 98671 and is currently estimated at $589,781, approximately $247 per square foot. 2526 48th St is a home located in Clark County with nearby schools including Gause Elementary School, Jemtegaard Middle School, and Washougal High School.
Ownership History
Date
Name
Owned For
Owner Type
Purchase Details
Closed on
Oct 16, 2015
Sold by
Kunz Gregory and Kunz Kim
Bought by
Bittinger Lacinda
Current Estimated Value
Home Financials for this Owner
Home Financials are based on the most recent Mortgage that was taken out on this home.
Original Mortgage
$90,000
Outstanding Balance
$70,787
Interest Rate
3.87%
Mortgage Type
New Conventional
Estimated Equity
$518,994
Purchase Details
Closed on
Aug 12, 2010
Sold by
Kunz Gregory
Bought by
Kunz Kim
Purchase Details
Closed on
Sep 25, 2008
Sold by
Kunz Kim
Bought by
Kunz Gregory
Home Financials for this Owner
Home Financials are based on the most recent Mortgage that was taken out on this home.
Original Mortgage
$247,503
Interest Rate
6.49%
Mortgage Type
FHA
Purchase Details
Closed on
Jul 21, 2008
Sold by
Holcombe Delton A and Holcombe Elise D
Bought by
M & T Bank
Purchase Details
Closed on
Jul 11, 2006
Sold by
Stone Karina G
Bought by
Holcombe Ii Delton A and Holcombe Elise D
Home Financials for this Owner
Home Financials are based on the most recent Mortgage that was taken out on this home.
Original Mortgage
$122,400
Interest Rate
6.57%
Mortgage Type
Stand Alone Second
Purchase Details
Closed on
Feb 17, 2006
Sold by
Rockford Homes Inc
Bought by
Stone Karina G
Home Financials for this Owner
Home Financials are based on the most recent Mortgage that was taken out on this home.
Original Mortgage
$61,000
Interest Rate
14.87%
Mortgage Type
Fannie Mae Freddie Mac
Purchase Details
Closed on
Aug 23, 2005
Sold by
Columbia View Group Llc
Bought by
Rockford Homes Inc
Home Financials for this Owner
Home Financials are based on the most recent Mortgage that was taken out on this home.
Original Mortgage
$743,700
Interest Rate
5.7%
Mortgage Type
Construction
Create a Home Valuation Report for This Property
The Home Valuation Report is an in-depth analysis detailing your home's value as well as a comparison with similar homes in the area
Home Values in the Area
Average Home Value in this Area
Purchase History
| Date | Buyer | Sale Price | Title Company |
|---|---|---|---|
| Bittinger Lacinda | $280,000 | Chicago Title Dt Vancouver | |
| Kunz Kim | -- | Clark County Title | |
| Kunz Gregory | -- | Chicago Title Insurance Co | |
| Kunz Gregory | $251,000 | Chicago Title Insurance Co | |
| M & T Bank | $222,354 | Chicago Title | |
| Holcombe Ii Delton A | $408,000 | Fidelity National Title | |
| Stone Karina G | $305,365 | First American Title | |
| Rockford Homes Inc | $584,000 | First American Title |
Source: Public Records
Mortgage History
| Date | Status | Borrower | Loan Amount |
|---|---|---|---|
| Open | Bittinger Lacinda | $90,000 | |
| Previous Owner | Kunz Gregory | $247,503 | |
| Previous Owner | Holcombe Ii Delton A | $122,400 | |
| Previous Owner | Holcombe Ii Delton A | $285,600 | |
| Previous Owner | Stone Karina G | $61,000 | |
| Previous Owner | Stone Karina G | $244,250 | |
| Previous Owner | Rockford Homes Inc | $743,700 |
Source: Public Records
Tax History Compared to Growth
Tax History
| Year | Tax Paid | Tax Assessment Tax Assessment Total Assessment is a certain percentage of the fair market value that is determined by local assessors to be the total taxable value of land and additions on the property. | Land | Improvement |
|---|---|---|---|---|
| 2025 | $4,779 | $514,867 | $120,000 | $394,867 |
| 2024 | $4,674 | $503,754 | $142,560 | $361,194 |
| 2023 | $4,930 | $515,680 | $164,088 | $351,592 |
| 2022 | $4,444 | $532,637 | $164,088 | $368,549 |
| 2021 | $4,471 | $416,577 | $128,040 | $288,537 |
| 2020 | $4,242 | $393,304 | $120,000 | $273,304 |
| 2019 | $3,550 | $379,059 | $120,000 | $259,059 |
| 2018 | $3,932 | $335,398 | $0 | $0 |
| 2017 | $3,431 | $306,652 | $0 | $0 |
| 2016 | $3,341 | $293,846 | $0 | $0 |
| 2015 | $3,269 | $261,637 | $0 | $0 |
| 2014 | -- | $254,708 | $0 | $0 |
| 2013 | -- | $220,553 | $0 | $0 |
Source: Public Records
Map
Nearby Homes