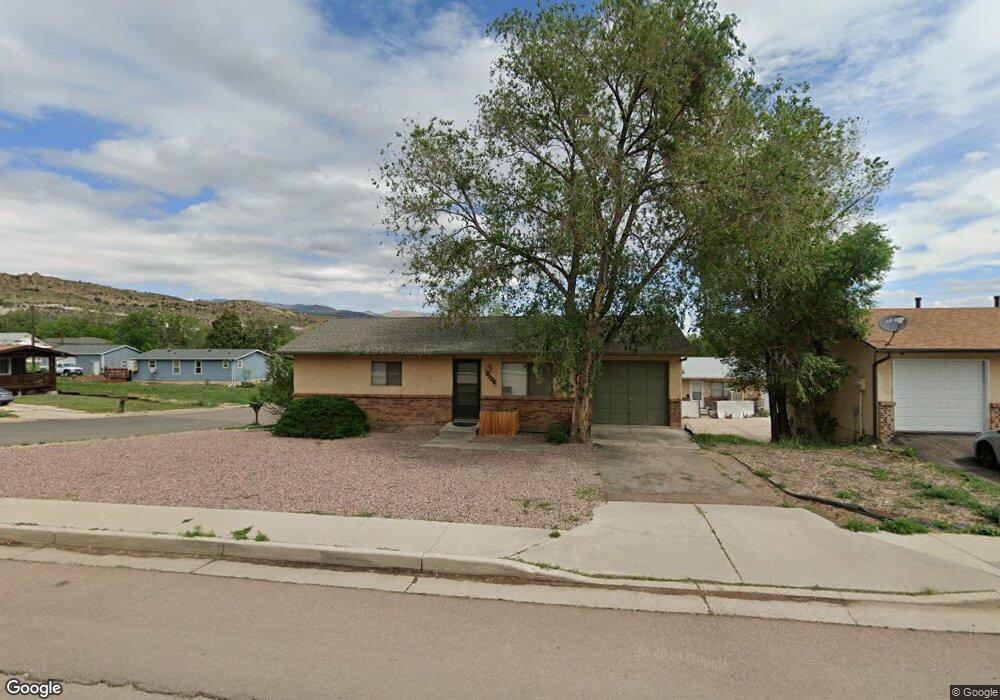
2526 Busch Ave Colorado Springs, CO 80904
Midland-Westside NeighborhoodEstimated Value: $421,410 - $481,000
4
Beds
2
Baths
792
Sq Ft
$556/Sq Ft
Est. Value
About This Home
This home is located at 2526 Busch Ave, Colorado Springs, CO 80904 and is currently estimated at $440,353, approximately $556 per square foot. 2526 Busch Ave is a home located in El Paso County with nearby schools including Midland Elementary School, West Middle School, and Coronado High School.
Ownership History
Date
Name
Owned For
Owner Type
Purchase Details
Closed on
Jul 30, 2019
Sold by
Wiebe P Lawrence and Wiebe Sandra
Bought by
Wiebe P Lawrence and Wiebe Sandra K
Current Estimated Value
Purchase Details
Closed on
Apr 3, 2012
Sold by
Wiebe Smith Leah
Bought by
Wiebe P Lawrence and Weibe Sandra
Purchase Details
Closed on
Feb 10, 2010
Sold by
Wiebe P Lawrence and Wiebe Sandra
Bought by
Wiebe P Lawrence and Wiebe Sandra
Purchase Details
Closed on
Dec 10, 1993
Sold by
Khan Feroze David and Khan Sandra Neish
Bought by
Wiebe P Lawrence and Wiebe Sandra
Home Financials for this Owner
Home Financials are based on the most recent Mortgage that was taken out on this home.
Original Mortgage
$54,250
Interest Rate
7.19%
Mortgage Type
Commercial
Purchase Details
Closed on
Mar 1, 1990
Bought by
Wiebe Sandra
Purchase Details
Closed on
Mar 1, 1989
Bought by
Wiebe Sandra
Purchase Details
Closed on
Feb 1, 1989
Bought by
Wiebe P Lawrence
Create a Home Valuation Report for This Property
The Home Valuation Report is an in-depth analysis detailing your home's value as well as a comparison with similar homes in the area
Home Values in the Area
Average Home Value in this Area
Purchase History
| Date | Buyer | Sale Price | Title Company |
|---|---|---|---|
| Wiebe P Lawrence | -- | None Available | |
| Wiebe P Lawrence | -- | None Available | |
| Wiebe P Lawrence | -- | None Available | |
| Wiebe P Lawrence | $77,500 | Land Title | |
| Wiebe Sandra | -- | -- | |
| Wiebe Sandra | -- | -- | |
| Wiebe P Lawrence | -- | -- |
Source: Public Records
Mortgage History
| Date | Status | Borrower | Loan Amount |
|---|---|---|---|
| Previous Owner | Wiebe P Lawrence | $54,250 |
Source: Public Records
Tax History Compared to Growth
Tax History
| Year | Tax Paid | Tax Assessment Tax Assessment Total Assessment is a certain percentage of the fair market value that is determined by local assessors to be the total taxable value of land and additions on the property. | Land | Improvement |
|---|---|---|---|---|
| 2025 | $1,289 | $27,970 | -- | -- |
| 2024 | $1,177 | $27,610 | $7,120 | $20,490 |
| 2022 | $1,081 | $19,320 | $4,080 | $15,240 |
| 2021 | $1,198 | $20,310 | $4,290 | $16,020 |
| 2020 | $1,144 | $16,860 | $3,580 | $13,280 |
| 2019 | $1,138 | $16,860 | $3,580 | $13,280 |
| 2018 | $995 | $13,560 | $2,380 | $11,180 |
| 2017 | $942 | $13,560 | $2,380 | $11,180 |
| 2016 | $746 | $12,870 | $2,390 | $10,480 |
| 2015 | $743 | $12,870 | $2,390 | $10,480 |
| 2014 | $744 | $12,370 | $2,390 | $9,980 |
Source: Public Records
Map
Nearby Homes
- 1426 Westend Ave
- 1015 Race St
- Ruby Plan at Evergreen Ridge
- Sapphire Plan at Evergreen Ridge
- Pearl Plan at Evergreen Ridge
- 1519 Arch St
- 1210 Westend Ave
- 1295 S 26th St
- 1019 Race St
- 2506 Hayes St
- 1019 Market St
- 2501 Ehrich St
- 125 Mountain Spirit Point
- 2560 Wheaton Dr
- 2025 Lone Willow View
- 1989 Lone Willow View
- 1971 Lone Willow View
- 1971 Lone Willow View Unit 45
- 808 S 24th St
- 2310 Hagerman St
- 2518 Busch Ave
- 1419 Langmeyer St
- 1415 Langmeyer St
- 2521 Busch Ave
- 2512 Busch Ave
- 1422 Langmeyer St
- 1418 Langmeyer St
- 1411 Langmeyer St
- 1412 Langmeyer St
- 1505 Langmeyer St
- 1502 Langmeyer St
- 1410 Langmeyer St
- 2517 Wheeler Ave
- 2509 Wheeler Ave Unit A
- 1504 Langmeyer St
- 2528 Busch Ave
- 1402 Langmeyer St
- 2507 Wheeler Ave
- 1415 Westend Ave
- 2527 South Blvd