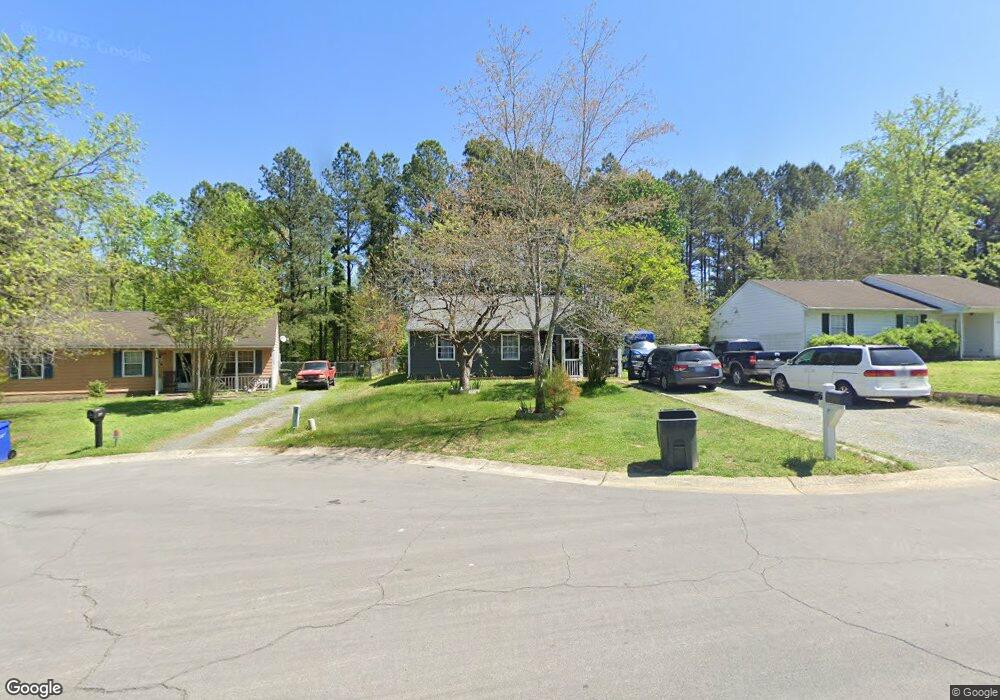
2526 Mahala Dr Durham, NC 27704
Northeast Durham NeighborhoodEstimated Value: $185,000 - $256,172
3
Beds
2
Baths
1,252
Sq Ft
$182/Sq Ft
Est. Value
About This Home
This home is located at 2526 Mahala Dr, Durham, NC 27704 and is currently estimated at $228,293, approximately $182 per square foot. 2526 Mahala Dr is a home located in Durham County with nearby schools including Sandy Ridge Elementary School, Lucas Middle School, and Northern High School.
Ownership History
Date
Name
Owned For
Owner Type
Purchase Details
Closed on
Aug 4, 2021
Sold by
Robles Elizabeth Angeles
Bought by
Lopez Mario Felipe Reyes
Current Estimated Value
Purchase Details
Closed on
Dec 22, 2010
Sold by
U S Bank National Association
Bought by
Robles Elizabeth Angeles
Home Financials for this Owner
Home Financials are based on the most recent Mortgage that was taken out on this home.
Original Mortgage
$56,610
Outstanding Balance
$38,526
Interest Rate
4.82%
Mortgage Type
New Conventional
Estimated Equity
$189,767
Purchase Details
Closed on
Jun 24, 2010
Sold by
Dediaz Juana Reyes and Chautla Martin Castro
Bought by
U S Bank National Association
Purchase Details
Closed on
Jun 22, 2006
Sold by
Mcnair John L and Mcnair Sheila P
Bought by
Dediaz Juana Reyes
Home Financials for this Owner
Home Financials are based on the most recent Mortgage that was taken out on this home.
Original Mortgage
$82,800
Interest Rate
9.4%
Mortgage Type
Balloon
Create a Home Valuation Report for This Property
The Home Valuation Report is an in-depth analysis detailing your home's value as well as a comparison with similar homes in the area
Home Values in the Area
Average Home Value in this Area
Purchase History
| Date | Buyer | Sale Price | Title Company |
|---|---|---|---|
| Lopez Mario Felipe Reyes | -- | None Available | |
| Robles Elizabeth Angeles | $63,000 | None Available | |
| U S Bank National Association | $93,150 | None Available | |
| Dediaz Juana Reyes | $103,500 | None Available |
Source: Public Records
Mortgage History
| Date | Status | Borrower | Loan Amount |
|---|---|---|---|
| Open | Robles Elizabeth Angeles | $56,610 | |
| Previous Owner | Dediaz Juana Reyes | $82,800 | |
| Previous Owner | Dediaz Juana Reyes | $20,700 |
Source: Public Records
Tax History
| Year | Tax Paid | Tax Assessment Tax Assessment Total Assessment is a certain percentage of the fair market value that is determined by local assessors to be the total taxable value of land and additions on the property. | Land | Improvement |
|---|---|---|---|---|
| 2025 | $1,979 | $199,591 | $75,000 | $124,591 |
| 2024 | $1,981 | $142,033 | $17,985 | $124,048 |
| 2023 | $1,861 | $142,033 | $17,985 | $124,048 |
| 2022 | $1,818 | $142,033 | $17,985 | $124,048 |
| 2021 | $1,809 | $142,033 | $17,985 | $124,048 |
| 2020 | $1,767 | $142,033 | $17,985 | $124,048 |
| 2019 | $1,767 | $142,033 | $17,985 | $124,048 |
| 2018 | $1,153 | $85,005 | $17,985 | $67,020 |
| 2017 | $1,145 | $85,005 | $17,985 | $67,020 |
| 2016 | $1,106 | $85,005 | $17,985 | $67,020 |
| 2015 | $1,482 | $107,073 | $21,100 | $85,973 |
| 2014 | -- | $107,073 | $21,100 | $85,973 |
Source: Public Records
Map
Nearby Homes
- 2507 Dearborn Dr
- 2509 Dearborn Dr
- 1410C Maplewood Dr
- 2609 Kingdom Way
- 2718 Thelma St
- 2720 Thelma St
- 2505 Roanoke St
- 1448 Maplewood Dr
- 1455 Maplewood Dr
- 1457 Maplewood Dr
- 3103 Dearborn Dr
- 3024 3026 Ruth St
- 928 Belvin Ave
- 802 Berwyn Ave
- 918 Cartman Dr
- 806 E Maynard Ave
- 3001 Corinth Ln
- 2206 E Club Blvd
- 2506 Dominion St
- 3306 Prudence St
- 2524 Mahala Dr
- 2528 Mahala Dr
- 2522 Mahala Dr
- 2530 Mahala Dr
- 2525 Mahala Dr
- 2520 Mahala Dr
- 2527 Mahala Dr
- 2523 Mahala Dr
- 2529 Mahala Dr
- 2531 Mahala Dr
- 2521 Mahala Dr
- 2518 Mahala Dr
- 2519 Mahala Dr
- 2600 Dearborn Dr
- 2526 Dearborn Dr
- 2602 Dearborn Dr
- 2516 Mahala Dr
- 2524 Dearborn Dr
- 2604 Dearborn Dr
- 2517 Mahala Dr
Your Personal Tour Guide
Ask me questions while you tour the home.