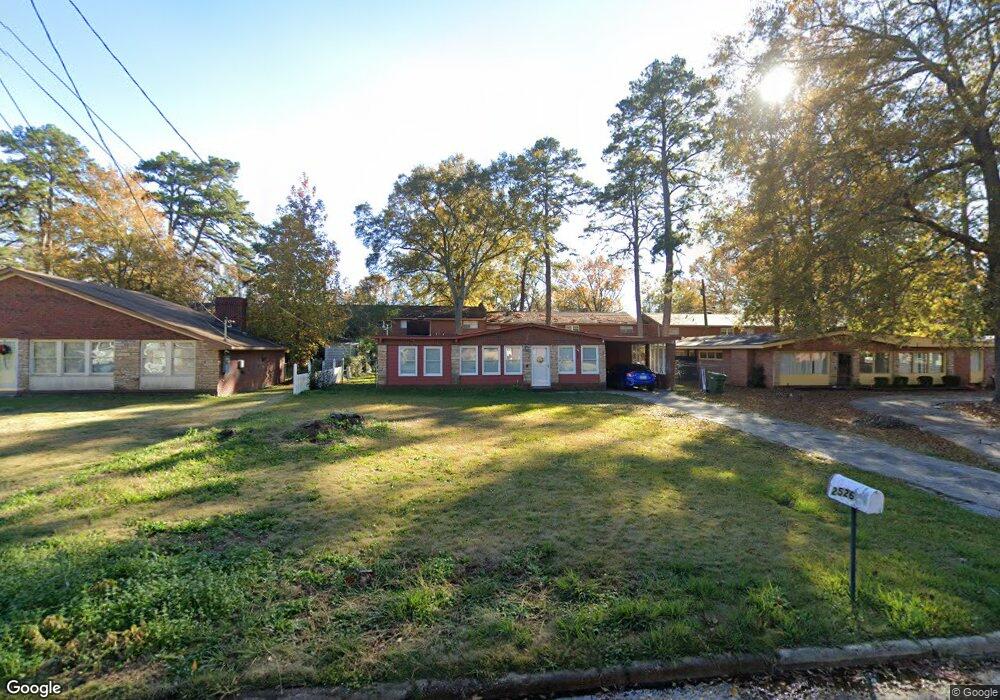
2526 Rice St Columbus, GA 31903
Southern Columbus NeighborhoodEstimated Value: $97,000 - $118,637
3
Beds
3
Baths
1,464
Sq Ft
$74/Sq Ft
Est. Value
About This Home
This home is located at 2526 Rice St, Columbus, GA 31903 and is currently estimated at $108,159, approximately $73 per square foot. 2526 Rice St is a home located in Muscogee County with nearby schools including Key Elementary School, Eddy Middle School, and Spencer High School.
Ownership History
Date
Name
Owned For
Owner Type
Purchase Details
Closed on
Aug 17, 2018
Sold by
G
Bought by
Pedrozo Paz G
Current Estimated Value
Purchase Details
Closed on
Jul 3, 2018
Sold by
Williams Bertha L
Bought by
G
Purchase Details
Closed on
Feb 18, 2016
Sold by
Wood Johnny Michael
Bought by
Wood Johnny Michael
Purchase Details
Closed on
Sep 30, 2010
Sold by
Clarke Devorn and Clarke Nneka
Bought by
Williams Bertha L
Home Financials for this Owner
Home Financials are based on the most recent Mortgage that was taken out on this home.
Original Mortgage
$66,360
Interest Rate
4.5%
Mortgage Type
FHA
Create a Home Valuation Report for This Property
The Home Valuation Report is an in-depth analysis detailing your home's value as well as a comparison with similar homes in the area
Home Values in the Area
Average Home Value in this Area
Purchase History
| Date | Buyer | Sale Price | Title Company |
|---|---|---|---|
| Pedrozo Paz G | $20,000 | -- | |
| G | $14,000 | -- | |
| Wood Johnny Michael | -- | -- | |
| Williams Bertha L | $69,900 | None Available |
Source: Public Records
Mortgage History
| Date | Status | Borrower | Loan Amount |
|---|---|---|---|
| Previous Owner | Williams Bertha L | $66,360 |
Source: Public Records
Tax History Compared to Growth
Tax History
| Year | Tax Paid | Tax Assessment Tax Assessment Total Assessment is a certain percentage of the fair market value that is determined by local assessors to be the total taxable value of land and additions on the property. | Land | Improvement |
|---|---|---|---|---|
| 2025 | $1,524 | $38,920 | $4,232 | $34,688 |
| 2024 | $1,531 | $38,920 | $4,232 | $34,688 |
| 2023 | $1,533 | $38,920 | $4,232 | $34,688 |
| 2022 | $1,218 | $29,832 | $4,232 | $25,600 |
| 2021 | $945 | $23,104 | $4,232 | $18,872 |
| 2020 | $944 | $23,104 | $4,232 | $18,872 |
| 2019 | $328 | $8,000 | $1,360 | $6,640 |
| 2018 | $599 | $29,020 | $4,232 | $24,788 |
| 2017 | $602 | $29,020 | $4,232 | $24,788 |
| 2016 | $606 | $29,416 | $3,360 | $26,056 |
| 2015 | $607 | $29,416 | $3,360 | $26,056 |
| 2014 | $609 | $29,416 | $3,360 | $26,056 |
| 2013 | -- | $29,416 | $3,360 | $26,056 |
Source: Public Records
Map
Nearby Homes
- 2317 Sharon Ave
- 2313 Dorothy Ave
- 2416 Broadmoor Dr
- 2550 Cornell Ave
- 2309 Ginny Ave
- 2846 Walker St
- 2425 Howe Ave
- 3015 Hendrix St
- 3042 Colonial Dr
- 2404 Bruce Ave
- 3310 Albert St
- 3009 Plantation Rd
- 2417 Manning Ave
- 2333 Bruce Ave
- 2102 Somerset Ave
- 2203 Simmons Ave
- 41 Ticknor Dr
- 2320 Fort Benning Rd
- 38 Ross Ave
- 122 Torch Hill Rd