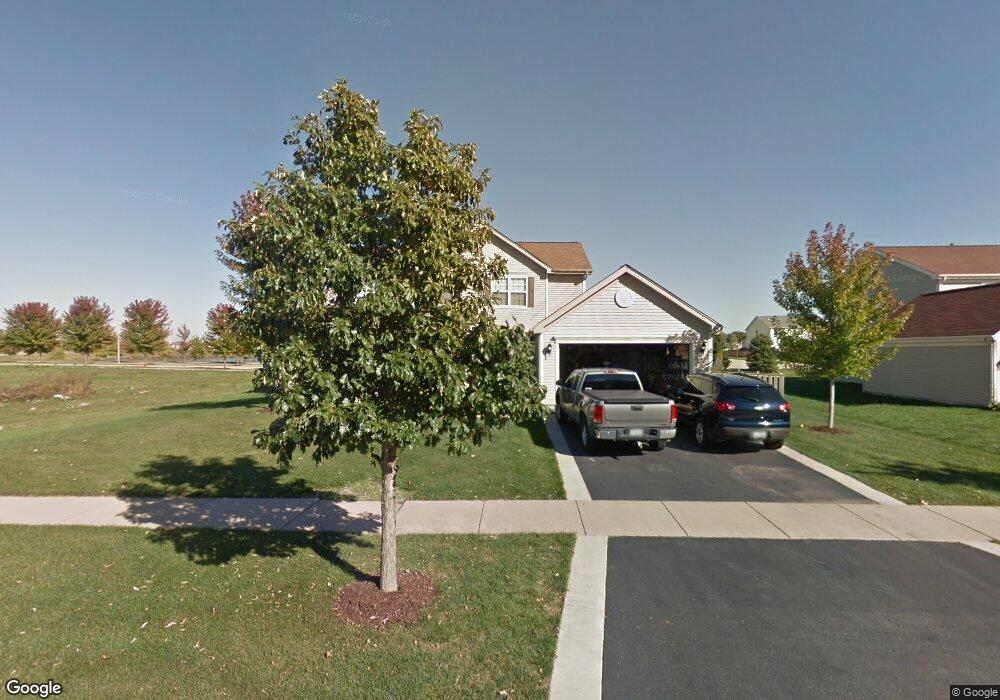
2526 Robert Ln Montgomery, IL 60538
South Montgomery NeighborhoodEstimated Value: $404,000 - $427,000
4
Beds
3
Baths
2,282
Sq Ft
$181/Sq Ft
Est. Value
About This Home
This home is located at 2526 Robert Ln, Montgomery, IL 60538 and is currently estimated at $413,930, approximately $181 per square foot. 2526 Robert Ln is a home located in Kendall County with nearby schools including Bristol Bay Elementary School, Yorkville Middle School, and Yorkville High School.
Ownership History
Date
Name
Owned For
Owner Type
Purchase Details
Closed on
Aug 21, 2009
Sold by
Weihofen Christine A C and West Christine A C
Bought by
Weihofen Erik J and Weihofen Christine A C
Current Estimated Value
Home Financials for this Owner
Home Financials are based on the most recent Mortgage that was taken out on this home.
Original Mortgage
$293,035
Outstanding Balance
$191,742
Interest Rate
5.28%
Mortgage Type
FHA
Estimated Equity
$222,188
Purchase Details
Closed on
Aug 15, 2007
Sold by
West Jeremy
Bought by
Cozzi Christine
Home Financials for this Owner
Home Financials are based on the most recent Mortgage that was taken out on this home.
Original Mortgage
$290,700
Interest Rate
6.66%
Mortgage Type
Purchase Money Mortgage
Purchase Details
Closed on
Jun 13, 2006
Sold by
Huntington Chase Lp
Bought by
West Jeremy M and West Christine A C
Home Financials for this Owner
Home Financials are based on the most recent Mortgage that was taken out on this home.
Original Mortgage
$278,233
Interest Rate
6.72%
Mortgage Type
FHA
Create a Home Valuation Report for This Property
The Home Valuation Report is an in-depth analysis detailing your home's value as well as a comparison with similar homes in the area
Home Values in the Area
Average Home Value in this Area
Purchase History
| Date | Buyer | Sale Price | Title Company |
|---|---|---|---|
| Weihofen Erik J | -- | North American Title Co | |
| Cozzi Christine | -- | Stewart Title Company | |
| West Jeremy M | $280,500 | Stewart Title Company |
Source: Public Records
Mortgage History
| Date | Status | Borrower | Loan Amount |
|---|---|---|---|
| Open | Weihofen Erik J | $293,035 | |
| Closed | Cozzi Christine | $290,700 | |
| Previous Owner | West Jeremy M | $278,233 |
Source: Public Records
Tax History Compared to Growth
Tax History
| Year | Tax Paid | Tax Assessment Tax Assessment Total Assessment is a certain percentage of the fair market value that is determined by local assessors to be the total taxable value of land and additions on the property. | Land | Improvement |
|---|---|---|---|---|
| 2024 | $9,570 | $118,299 | $13,302 | $104,997 |
| 2023 | $8,815 | $105,841 | $11,901 | $93,940 |
| 2022 | $8,815 | $96,088 | $10,804 | $85,284 |
| 2021 | $8,381 | $89,771 | $10,804 | $78,967 |
| 2020 | $8,205 | $86,734 | $10,804 | $75,930 |
| 2019 | $8,034 | $83,406 | $10,389 | $73,017 |
| 2018 | $7,671 | $78,867 | $10,389 | $68,478 |
| 2017 | $7,482 | $73,253 | $10,389 | $62,864 |
| 2016 | $7,059 | $67,228 | $10,389 | $56,839 |
| 2015 | $6,630 | $60,743 | $9,354 | $51,389 |
| 2014 | -- | $63,806 | $9,354 | $54,452 |
| 2013 | -- | $63,806 | $9,354 | $54,452 |
Source: Public Records
Map
Nearby Homes
- 3100 Manchester Dr
- 2335 Thunder Gulch Rd Unit 4
- 3177 Whirlaway Ln
- 2524 Prairie Crossing Dr
- 19 Brookside Ln
- 3026 Gaylord Ln
- 2906 Meadowview Ln
- 2930 Heather Ln Unit 1
- 3401 Helene Rieder Dr
- 2254 Gallant Fox Cir Unit 303
- 2212 Gallant Fox Cir Unit 702
- 17 Basswood Ct
- 2302 Rebecca Cir Unit 4
- 4478 Sarasota Ave
- 2286 Margaret Dr
- 2891 Frances Ln
- 1850 Candlelight Cir Unit 173
- 2007 Chad Ct
- 412 Biscayne Ln
- 2666 Big Grove Cir
- 2532 Robert Ln
- 2538 Robert Ln
- 3202 Huntington Ln
- 3198 Patterson Rd
- 3208 Huntington Ln
- 2544 Robert Ln
- 5502 Patterson Rd
- 5501 Patterson Rd
- 3201 Huntington Ln
- 3190 Patterson Rd
- 3188 Patterson Rd
- 3214 Huntington Ln
- 2550 Robert Ln
- 3197 Manchester Dr
- 3182 Patterson Rd
- 3213 Huntington Ln
- 3220 Huntington Ln
- 3189 Manchester Dr
- 3204 Thomas Ln
- 2556 Robert Ln