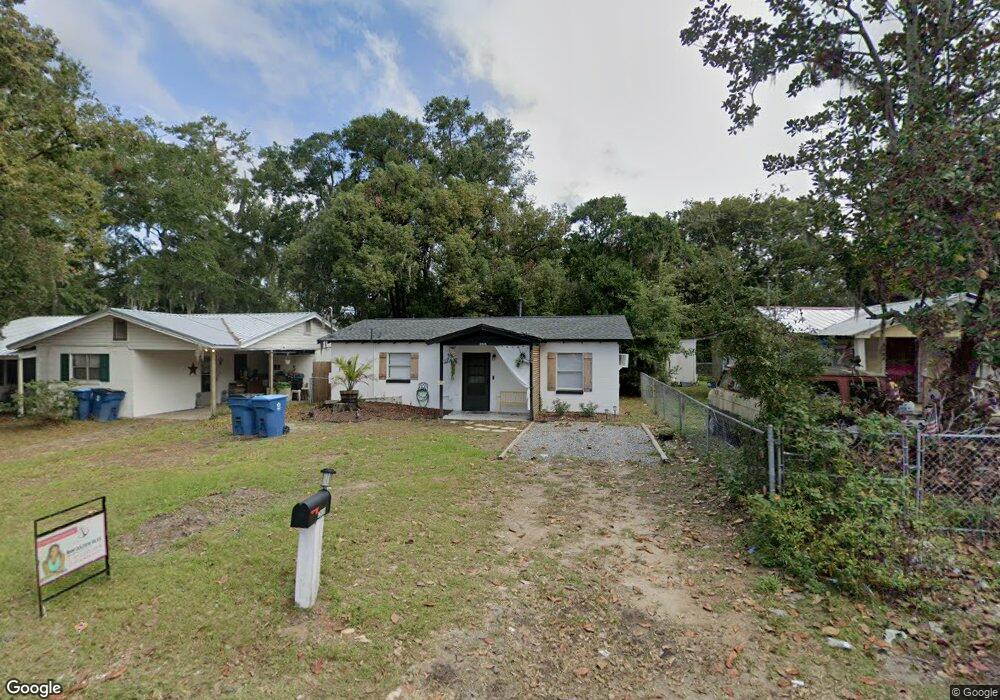
2526 Union St Brunswick, GA 31520
New Town NeighborhoodEstimated Value: $101,000 - $153,000
2
Beds
1
Bath
875
Sq Ft
$146/Sq Ft
Est. Value
About This Home
This home is located at 2526 Union St, Brunswick, GA 31520 and is currently estimated at $127,531, approximately $145 per square foot. 2526 Union St is a home located in Glynn County with nearby schools including Goodyear Elementary School, Risley Middle School, and Glynn Academy.
Ownership History
Date
Name
Owned For
Owner Type
Purchase Details
Closed on
Jan 31, 2022
Sold by
Banks Arthur A
Bought by
Coastal Ga Property Solutions Llc
Current Estimated Value
Purchase Details
Closed on
Jan 7, 2019
Sold by
Jerilyn Cribbs Barker Llc
Bought by
Banks Arthur A
Purchase Details
Closed on
Jul 15, 2014
Sold by
Barker Jerilyn Cribbs
Bought by
Jerilyn Cribbs Barker Llc
Purchase Details
Closed on
Jun 25, 2009
Sold by
B E C Enterprises Inc
Bought by
Barker Jerilyn Cribbs
Create a Home Valuation Report for This Property
The Home Valuation Report is an in-depth analysis detailing your home's value as well as a comparison with similar homes in the area
Home Values in the Area
Average Home Value in this Area
Purchase History
| Date | Buyer | Sale Price | Title Company |
|---|---|---|---|
| Coastal Ga Property Solutions Llc | $45,000 | -- | |
| Banks Arthur A | $39,650 | -- | |
| Jerilyn Cribbs Barker Llc | -- | -- | |
| Barker Jerilyn Cribbs | -- | -- |
Source: Public Records
Tax History Compared to Growth
Tax History
| Year | Tax Paid | Tax Assessment Tax Assessment Total Assessment is a certain percentage of the fair market value that is determined by local assessors to be the total taxable value of land and additions on the property. | Land | Improvement |
|---|---|---|---|---|
| 2025 | $795 | $37,840 | $2,120 | $35,720 |
| 2024 | $832 | $39,560 | $2,120 | $37,440 |
| 2023 | $2,086 | $39,560 | $2,120 | $37,440 |
| 2022 | $858 | $19,280 | $2,120 | $17,160 |
| 2021 | $719 | $13,920 | $2,120 | $11,800 |
| 2020 | $705 | $15,600 | $2,120 | $13,480 |
| 2019 | $178 | $8,040 | $2,120 | $5,920 |
| 2018 | $235 | $9,800 | $2,120 | $7,680 |
| 2017 | $621 | $9,800 | $2,120 | $7,680 |
| 2016 | $475 | $8,040 | $2,120 | $5,920 |
| 2015 | $518 | $8,640 | $2,120 | $6,520 |
| 2014 | $518 | $8,640 | $2,120 | $6,520 |
Source: Public Records
Map
Nearby Homes