Estimated Value: $386,000 - $396,565
4
Beds
2
Baths
1,881
Sq Ft
$209/Sq Ft
Est. Value
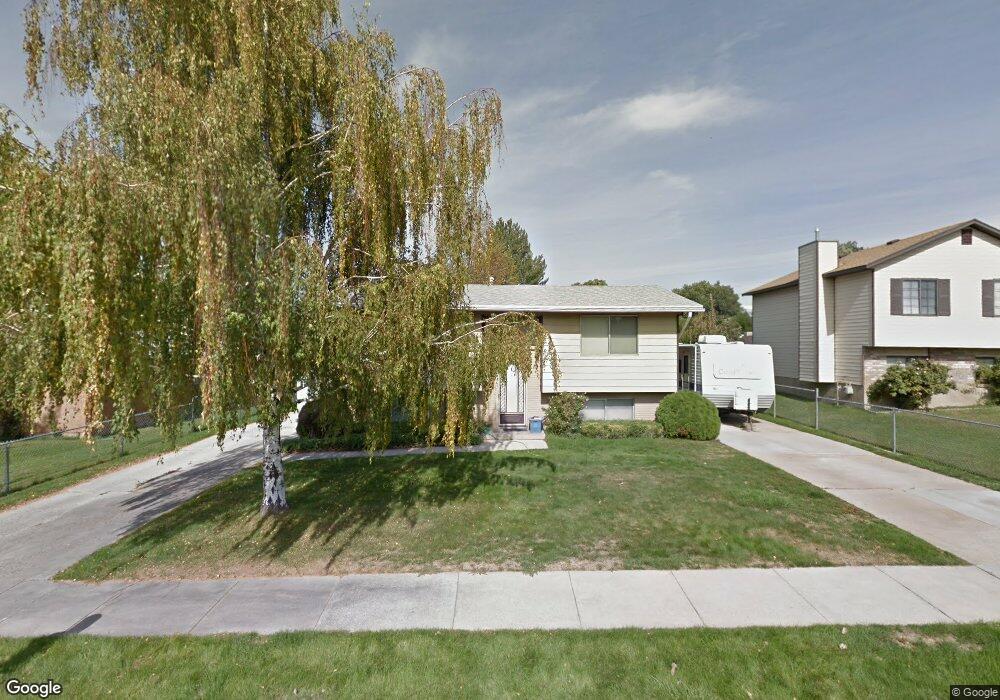
About This Home
This home is located at 2526 W 6075 S, Roy, UT 84067 and is currently estimated at $392,891, approximately $208 per square foot. 2526 W 6075 S is a home located in Weber County with nearby schools including Municipal School, Roy Junior High School, and Roy High School.
Ownership History
Date
Name
Owned For
Owner Type
Purchase Details
Closed on
Feb 4, 2022
Sold by
Carmen Velazquez
Bought by
Velazquez Carmen and Cortes Jose Luis
Current Estimated Value
Home Financials for this Owner
Home Financials are based on the most recent Mortgage that was taken out on this home.
Original Mortgage
$253,500
Outstanding Balance
$235,394
Interest Rate
3.55%
Mortgage Type
New Conventional
Estimated Equity
$157,497
Purchase Details
Closed on
Oct 22, 2019
Sold by
Stephens Matthew T
Bought by
Velazquez Carmen
Home Financials for this Owner
Home Financials are based on the most recent Mortgage that was taken out on this home.
Original Mortgage
$240,562
Interest Rate
3.39%
Mortgage Type
FHA
Purchase Details
Closed on
May 9, 2013
Sold by
Hansen Vicky R and Hansen Debra R
Bought by
Stephens Matthew T
Home Financials for this Owner
Home Financials are based on the most recent Mortgage that was taken out on this home.
Original Mortgage
$5,749
Interest Rate
3.54%
Mortgage Type
Stand Alone Second
Create a Home Valuation Report for This Property
The Home Valuation Report is an in-depth analysis detailing your home's value as well as a comparison with similar homes in the area
Home Values in the Area
Average Home Value in this Area
Purchase History
| Date | Buyer | Sale Price | Title Company |
|---|---|---|---|
| Velazquez Carmen | -- | Vanguard Title | |
| Velazquez Carmen | -- | South Valley Title Ins Agcy | |
| Stephens Matthew T | -- | Bonneville Superior Title Co |
Source: Public Records
Mortgage History
| Date | Status | Borrower | Loan Amount |
|---|---|---|---|
| Open | Velazquez Carmen | $253,500 | |
| Previous Owner | Velazquez Carmen | $240,562 | |
| Previous Owner | Stephens Matthew T | $5,749 | |
| Previous Owner | Stephens Matthew T | $125,582 |
Source: Public Records
Tax History Compared to Growth
Tax History
| Year | Tax Paid | Tax Assessment Tax Assessment Total Assessment is a certain percentage of the fair market value that is determined by local assessors to be the total taxable value of land and additions on the property. | Land | Improvement |
|---|---|---|---|---|
| 2025 | $2,467 | $388,342 | $120,026 | $268,316 |
| 2024 | $2,274 | $196,899 | $66,014 | $130,885 |
| 2023 | $2,149 | $185,900 | $65,864 | $120,036 |
| 2022 | $2,308 | $207,350 | $57,758 | $149,592 |
| 2021 | $1,865 | $274,000 | $75,002 | $198,998 |
| 2020 | $1,742 | $235,000 | $75,002 | $159,998 |
| 2019 | $1,631 | $206,000 | $44,976 | $161,024 |
| 2018 | $1,485 | $175,000 | $40,002 | $134,998 |
| 2017 | $1,455 | $161,000 | $37,050 | $123,950 |
| 2016 | $1,328 | $78,276 | $16,499 | $61,777 |
| 2015 | $1,179 | $70,345 | $16,499 | $53,846 |
| 2014 | $1,249 | $74,530 | $16,499 | $58,031 |
Source: Public Records
Map
Nearby Homes