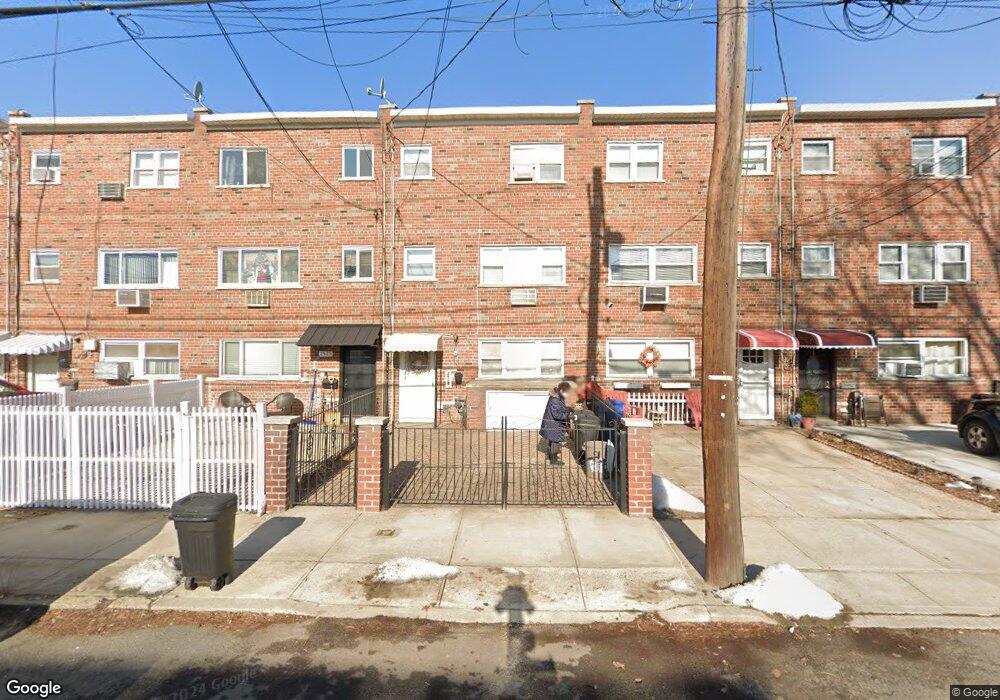
2527 Hollers Ave Bronx, NY 10475
Eastchester NeighborhoodEstimated Value: $616,685 - $833,000
--
Bed
--
Bath
1,836
Sq Ft
$419/Sq Ft
Est. Value
About This Home
This home is located at 2527 Hollers Ave, Bronx, NY 10475 and is currently estimated at $768,421, approximately $418 per square foot. 2527 Hollers Ave is a home located in Bronx County with nearby schools including Cornerstone Academy For Social Action, One World Middle School At Edenwald, and Baychester Middle School.
Create a Home Valuation Report for This Property
The Home Valuation Report is an in-depth analysis detailing your home's value as well as a comparison with similar homes in the area
Home Values in the Area
Average Home Value in this Area
Tax History Compared to Growth
Tax History
| Year | Tax Paid | Tax Assessment Tax Assessment Total Assessment is a certain percentage of the fair market value that is determined by local assessors to be the total taxable value of land and additions on the property. | Land | Improvement |
|---|---|---|---|---|
| 2025 | $3,684 | $28,556 | $6,179 | $22,377 |
| 2024 | $3,684 | $26,940 | $6,496 | $20,444 |
| 2023 | $2,481 | $25,416 | $7,093 | $18,323 |
| 2022 | $3,457 | $31,800 | $9,360 | $22,440 |
| 2021 | $3,587 | $30,420 | $9,360 | $21,060 |
| 2020 | $3,362 | $33,600 | $9,360 | $24,240 |
| 2019 | $3,033 | $29,700 | $9,360 | $20,340 |
| 2018 | $2,680 | $21,180 | $9,360 | $11,820 |
| 2017 | $3,714 | $23,880 | $9,360 | $14,520 |
| 2016 | $3,551 | $23,340 | $9,360 | $13,980 |
| 2015 | $2,307 | $24,660 | $10,380 | $14,280 |
| 2014 | $2,307 | $24,660 | $10,380 | $14,280 |
Source: Public Records
Map
Nearby Homes
- 3511 Mc Owen Ave
- 3550 Huguenot Ave
- 3549 Ropes Ave
- 982 Split Rock Rd
- 889 James St
- 991 Grant Ave
- 89 Park Dr
- 839 James St
- 973 Plymouth St
- 3735 Rombouts Ave
- 3992 Rombouts Ave
- 1020 Grant Ave
- 15 Saint Pauls Place
- 668 Francis St
- 3946 Secor Ave
- 78 Oak Ln
- 4003 Secor Ave
- 42 Wildwood Ave
- 1091 Hunter Ave
- 2123 Garrett Place
- 2525 Hollers Ave
- 2529 Hollers Ave Unit 1
- 2529 Hollers Ave
- 2531 Hollers Ave
- 2523 Hollers Ave
- 2533 Hollers Ave
- 2521 Hollers Ave
- 2535 Hollers Ave
- 2537 Hollers Ave
- 3510 Huguenot Ave
- 2539 Hollers Ave Unit A
- 2539 Hollers Ave
- 3515 Mc Owen Ave
- 3517 Mc Owen Ave
- 2526 Hollers Ave
- 2522 Hollers Ave
- 3518 Huguenot Ave
- 2530 Hollers Ave
- 2520 Hollers Ave
- 2534 Hollers Ave