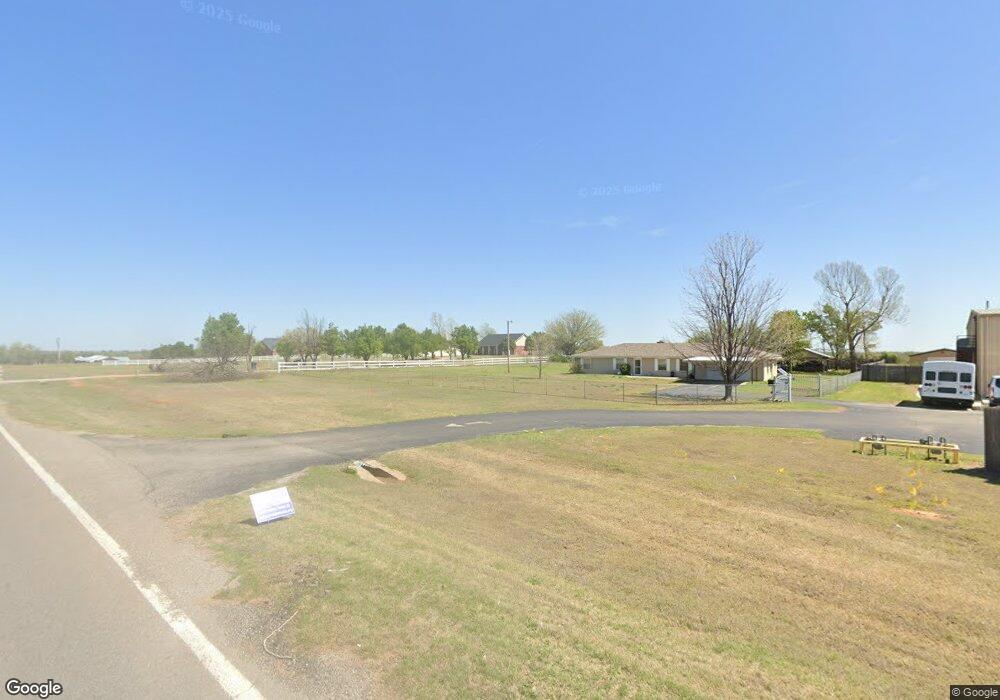
2528 N Highway 76 Newcastle, OK 73065
Estimated Value: $368,556 - $450,000
3
Beds
2
Baths
2,166
Sq Ft
$188/Sq Ft
Est. Value
About This Home
This home is located at 2528 N Highway 76, Newcastle, OK 73065 and is currently estimated at $407,639, approximately $188 per square foot. 2528 N Highway 76 is a home located in McClain County with nearby schools including Newcastle Elementary School, Newcastle Middle School, and Newcastle High School.
Ownership History
Date
Name
Owned For
Owner Type
Purchase Details
Closed on
Aug 5, 2020
Sold by
Mccoy Gary W and Mccoy Diana R
Bought by
Department Of Transportation
Current Estimated Value
Purchase Details
Closed on
Jun 27, 2013
Sold by
Miller John Gilbert
Bought by
Mccoy Gary W and Mccoy Diana R
Home Financials for this Owner
Home Financials are based on the most recent Mortgage that was taken out on this home.
Original Mortgage
$178,500
Interest Rate
3.83%
Mortgage Type
New Conventional
Purchase Details
Closed on
Jan 10, 2013
Sold by
Miller Amy Suzanne and Miller Amy
Bought by
Miller John and Miller John Gilbert
Purchase Details
Closed on
Oct 18, 2012
Sold by
Miller Amy
Bought by
Miller John
Purchase Details
Closed on
Jul 7, 2004
Sold by
Hoskins Betty and Hoskins Mark
Bought by
Miller John G and Miller Amy S
Create a Home Valuation Report for This Property
The Home Valuation Report is an in-depth analysis detailing your home's value as well as a comparison with similar homes in the area
Home Values in the Area
Average Home Value in this Area
Purchase History
| Date | Buyer | Sale Price | Title Company |
|---|---|---|---|
| Department Of Transportation | -- | None Available | |
| Mccoy Gary W | $245,000 | None Available | |
| Miller John | -- | None Available | |
| Miller John | -- | None Available | |
| Miller John G | $230,000 | -- |
Source: Public Records
Mortgage History
| Date | Status | Borrower | Loan Amount |
|---|---|---|---|
| Previous Owner | Mccoy Gary W | $178,500 |
Source: Public Records
Tax History Compared to Growth
Tax History
| Year | Tax Paid | Tax Assessment Tax Assessment Total Assessment is a certain percentage of the fair market value that is determined by local assessors to be the total taxable value of land and additions on the property. | Land | Improvement |
|---|---|---|---|---|
| 2025 | $3,160 | $29,423 | $5,011 | $24,412 |
| 2024 | $3,160 | $28,566 | $4,865 | $23,701 |
| 2023 | $3,160 | $27,733 | $4,646 | $23,087 |
| 2022 | $3,086 | $27,733 | $4,646 | $23,087 |
| 2021 | $3,238 | $27,733 | $4,646 | $23,087 |
| 2020 | $3,309 | $28,202 | $6,160 | $22,042 |
| 2019 | $3,487 | $29,240 | $7,856 | $21,384 |
| 2018 | $3,331 | $28,389 | $7,759 | $20,630 |
| 2017 | $3,223 | $27,563 | $6,715 | $20,848 |
| 2016 | $3,138 | $26,760 | $6,715 | $20,045 |
| 2015 | $3,044 | $25,980 | $6,171 | $19,809 |
| 2014 | $3,121 | $26,950 | $4,653 | $22,297 |
Source: Public Records
Map
Nearby Homes
- 2676 Pistache Way
- 2665 Pistache Way
- Springfield Plan at Oakmont
- Seattle Plan at Oakmont
- Romans Plan at Oakmont
- Matthew Plan at Oakmont
- Jordan Plan at Oakmont
- Jackson Plan at Oakmont
- Galatians Plan at Oakmont
- David Plan at Oakmont
- 2726 NW 26th Terrace
- 3167 Castle Creek Dr
- 2908 Redwood Ct
- 1063 Pulchella Way
- 1121 SE 17th St
- 3240 N Council Ave
- 1230 Acclivis Ct
- 1111 Acclivis Way
- 912 Acclivis Cir
- 1118 Acclivis Way
- 3120 NW 26th St
- 3113 NW 24th St
- 3037 NW 26th St
- 3133 NW 24th St
- 3119 NW 26th St
- 3041 NW 26th St
- 3000 NW 26th St
- 3021 NW 24th St
- 2605 N Highway 76
- 2380 Cornerstone Dr
- 3131 NW 23rd St
- 3169 NW 23rd St
- 3105 NW 23rd St
- 3073 NW 23rd St
- 2940 NW 26th St
- 2601 N Highway 76
- 2301 Ridgeway
- 3022 NW 24th St
- 3437 NW 24th St
- 2298 Cornerstone Dr