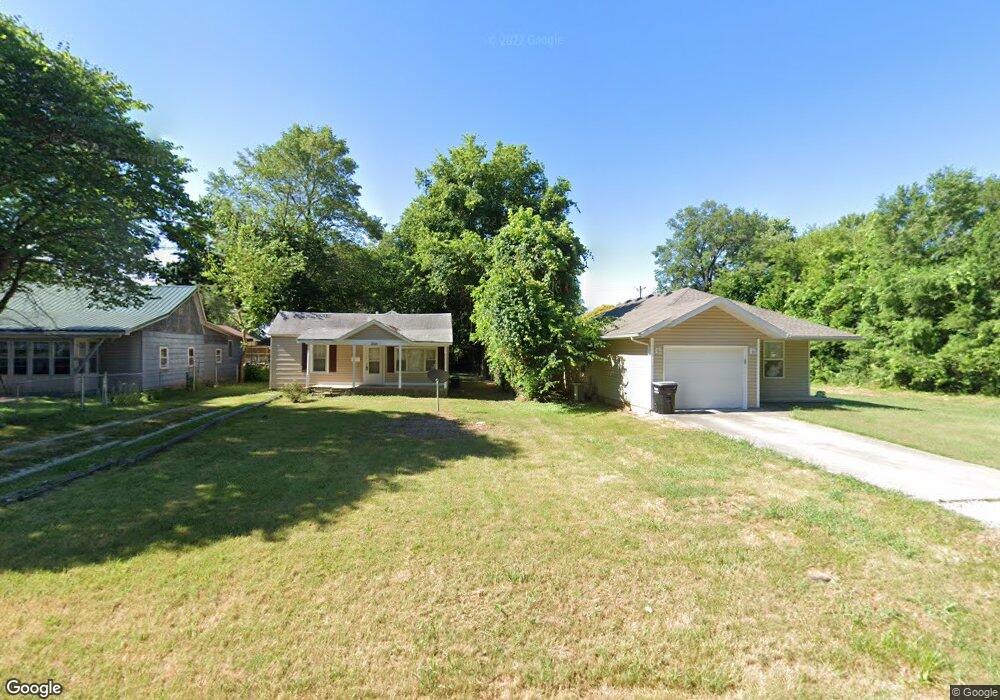
2528 W Madison St Springfield, MO 65802
Westside NeighborhoodEstimated Value: $279,000 - $309,000
2
Beds
1
Bath
1,856
Sq Ft
$155/Sq Ft
Est. Value
About This Home
This home is located at 2528 W Madison St, Springfield, MO 65802 and is currently estimated at $287,093, approximately $154 per square foot. 2528 W Madison St is a home located in Greene County with nearby schools including Central High School and Phelps Center for Gifted Education.
Ownership History
Date
Name
Owned For
Owner Type
Purchase Details
Closed on
Aug 27, 2021
Sold by
Mcdonough Matthew B
Bought by
Davison Nila J
Current Estimated Value
Home Financials for this Owner
Home Financials are based on the most recent Mortgage that was taken out on this home.
Original Mortgage
$201,875
Outstanding Balance
$183,691
Interest Rate
2.8%
Mortgage Type
New Conventional
Estimated Equity
$103,402
Purchase Details
Closed on
Aug 25, 2017
Sold by
Boles Shelley L and Cordray Candy E
Bought by
Mcdonough Matthew B
Home Financials for this Owner
Home Financials are based on the most recent Mortgage that was taken out on this home.
Original Mortgage
$142,025
Interest Rate
4.03%
Mortgage Type
New Conventional
Purchase Details
Closed on
Sep 14, 2007
Sold by
Oak Grove Landing Homes Llc
Bought by
Boles Shelly L and Cordray Candy E
Home Financials for this Owner
Home Financials are based on the most recent Mortgage that was taken out on this home.
Original Mortgage
$69,900
Interest Rate
6.66%
Mortgage Type
New Conventional
Create a Home Valuation Report for This Property
The Home Valuation Report is an in-depth analysis detailing your home's value as well as a comparison with similar homes in the area
Home Values in the Area
Average Home Value in this Area
Purchase History
We collect this data history from publicly available records. To have your information removed, we recommend requesting removal directly through your county’s website.
| Date | Buyer | Sale Price | Title Company |
|---|---|---|---|
| Davison Nila J | -- | None Available | |
| Mcdonough Matthew B | -- | None Available | |
| Boles Shelly L | -- | Lincoln Evans Land Title Co |
Source: Public Records
Mortgage History
We collect this data history from publicly available records. To have your information removed, we recommend requesting removal directly through your county’s website.
| Date | Status | Borrower | Loan Amount |
|---|---|---|---|
| Open | Davison Nila J | $201,875 | |
| Previous Owner | Mcdonough Matthew B | $142,025 | |
| Previous Owner | Boles Shelly L | $69,900 |
Source: Public Records
Tax History
| Year | Tax Paid | Tax Assessment Tax Assessment Total Assessment is a certain percentage of the fair market value that is determined by local assessors to be the total taxable value of land and additions on the property. | Land | Improvement |
|---|---|---|---|---|
| 2025 | $2,080 | $41,740 | $5,700 | $36,040 |
| 2024 | $2,032 | $37,870 | $4,750 | $33,120 |
| 2023 | $2,020 | $37,870 | $4,750 | $33,120 |
| 2022 | $1,691 | $30,970 | $4,750 | $26,220 |
| 2021 | $1,691 | $30,970 | $4,750 | $26,220 |
| 2020 | $1,645 | $28,800 | $4,750 | $24,050 |
| 2019 | $1,598 | $28,800 | $4,750 | $24,050 |
| 2018 | $1,610 | $29,030 | $3,800 | $25,230 |
| 2017 | $1,594 | $28,060 | $3,800 | $24,260 |
| 2016 | $1,538 | $28,060 | $3,800 | $24,260 |
| 2015 | $1,524 | $28,060 | $3,800 | $24,260 |
| 2014 | $1,477 | $27,000 | $3,800 | $23,200 |
Source: Public Records
Map
Nearby Homes
- 839 S West Ave
- 2552 W Madison St
- 2556 W Madison St
- 2416 W Monroe St
- 2540 W State St
- 2544 W State St
- 917 S West Ave
- 2634 W Madison St
- 2631 W Madison St
- 2316 W Page St
- 2551 W Grand St
- 2644 W Lombard St
- 641 S Warren Ave
- 549 S West Ave
- 2623 W Mount Vernon St
- 2516 W Elm St
- 503 S Forest Ct
- 421 S West Ave
- 2526 W Walnut St
- 629 S Glenn Ave
- 2510 W Madison St
- 2506 W Madison St
- 2516 W Madison St
- 2520 W Madison St
- 811 S West Ave
- 2505 W Madison St
- 2526 W Madison St
- 2530 W Madison St
- 2517 W Madison St
- 759 S West Ave
- 2521 W Madison St
- 2517 W Page St
- 2538 W Madison St
- 2440 W Madison St
- 2527 W Madison St
- 2525 W Page St
- 829 S West Ave
- 814 S West Ave
- 751 S West Ave
- 2531 W Madison St
Your Personal Tour Guide
Ask me questions while you tour the home.