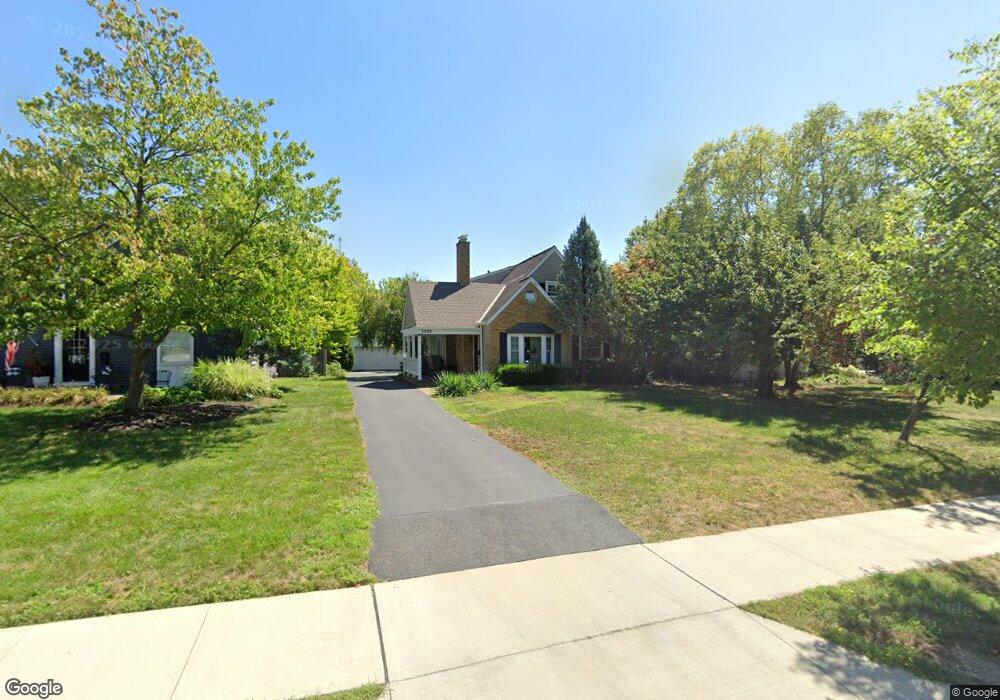
2528 Westmont Blvd Columbus, OH 43221
Estimated Value: $695,596 - $847,000
4
Beds
3
Baths
2,340
Sq Ft
$316/Sq Ft
Est. Value
About This Home
This home is located at 2528 Westmont Blvd, Columbus, OH 43221 and is currently estimated at $738,399, approximately $315 per square foot. 2528 Westmont Blvd is a home located in Franklin County with nearby schools including Tremont Elementary School, Jones Middle School, and Upper Arlington High School.
Ownership History
Date
Name
Owned For
Owner Type
Purchase Details
Closed on
Jul 8, 2010
Sold by
Henterly Thomas J and Henterly Nancy E
Bought by
Whitehouse Peter T
Current Estimated Value
Home Financials for this Owner
Home Financials are based on the most recent Mortgage that was taken out on this home.
Original Mortgage
$215,000
Outstanding Balance
$143,227
Interest Rate
4.77%
Mortgage Type
New Conventional
Estimated Equity
$595,172
Purchase Details
Closed on
Jun 30, 2000
Sold by
Mangum Stephen L and Mangum Troba N
Bought by
Henterly Thomas J and Henterly Nancy E
Home Financials for this Owner
Home Financials are based on the most recent Mortgage that was taken out on this home.
Original Mortgage
$180,000
Interest Rate
8.64%
Purchase Details
Closed on
Jun 3, 1988
Bought by
Mangum Stephen L
Purchase Details
Closed on
Aug 1, 1986
Purchase Details
Closed on
Jan 1, 1986
Create a Home Valuation Report for This Property
The Home Valuation Report is an in-depth analysis detailing your home's value as well as a comparison with similar homes in the area
Home Values in the Area
Average Home Value in this Area
Purchase History
| Date | Buyer | Sale Price | Title Company |
|---|---|---|---|
| Whitehouse Peter T | $341,000 | Talon Group | |
| Henterly Thomas J | $238,500 | Stewart Title Agency Of Colu | |
| Mangum Stephen L | $100,000 | -- | |
| -- | -- | -- | |
| -- | -- | -- |
Source: Public Records
Mortgage History
| Date | Status | Borrower | Loan Amount |
|---|---|---|---|
| Open | Whitehouse Peter T | $215,000 | |
| Previous Owner | Henterly Thomas J | $180,000 |
Source: Public Records
Tax History Compared to Growth
Tax History
| Year | Tax Paid | Tax Assessment Tax Assessment Total Assessment is a certain percentage of the fair market value that is determined by local assessors to be the total taxable value of land and additions on the property. | Land | Improvement |
|---|---|---|---|---|
| 2024 | $10,656 | $184,070 | $78,650 | $105,420 |
| 2023 | $10,524 | $184,065 | $78,645 | $105,420 |
| 2022 | $10,326 | $147,770 | $48,720 | $99,050 |
| 2021 | $9,141 | $147,770 | $48,720 | $99,050 |
| 2020 | $9,060 | $147,770 | $48,720 | $99,050 |
| 2019 | $8,626 | $124,390 | $48,720 | $75,670 |
| 2018 | $8,465 | $124,390 | $48,720 | $75,670 |
| 2017 | $8,559 | $124,390 | $48,720 | $75,670 |
| 2016 | $8,334 | $126,040 | $31,640 | $94,400 |
| 2015 | $8,326 | $126,040 | $31,640 | $94,400 |
| 2014 | $8,336 | $126,040 | $31,640 | $94,400 |
| 2013 | $3,981 | $114,590 | $28,770 | $85,820 |
Source: Public Records
Map
Nearby Homes
- 2569 Chester Rd
- 2648 Chester Rd
- 2615 Northwest Blvd
- 1565 Berkshire Rd
- 1535 Doone Rd
- 1980 W Lane Ave
- 1481 Doone Rd
- 2110 Northwest Blvd
- 3015 Welsford Rd
- 2063 Westover Rd
- 1909 Inchcliff Rd
- 2027-2033 Ridgeview Rd
- 1887-1891 Kentwell Rd
- 3106 Somerford Rd
- 1111 Sunny Hill Dr
- 3156 Mt Holyoke Rd
- 1098 Stanhope Dr
- 1837 Elmwood Ave
- 1398 Lower Green Cir Unit 1398
- 1825 Northwest Ct Unit D
- 2520 Westmont Blvd
- 2536 Westmont Blvd
- 2544 Westmont Blvd
- 2512 Westmont Blvd
- 2527 Mount Holyoke Rd
- 2535 Mount Holyoke Rd
- 2519 Mount Holyoke Rd
- 2494 Westmont Blvd
- 2506 Westmont Blvd
- 2552 Westmont Blvd
- 2543 Mount Holyoke Rd
- 2490 Westmont Blvd
- 2513 Mount Holyoke Rd
- 2553 Mount Holyoke Rd
- 2535 Westmont Blvd
- 2498 Westmont Blvd
- 2560 Westmont Blvd
- 2527 Westmont Blvd
- 2543 Westmont Blvd
- 2521 Westmont Blvd