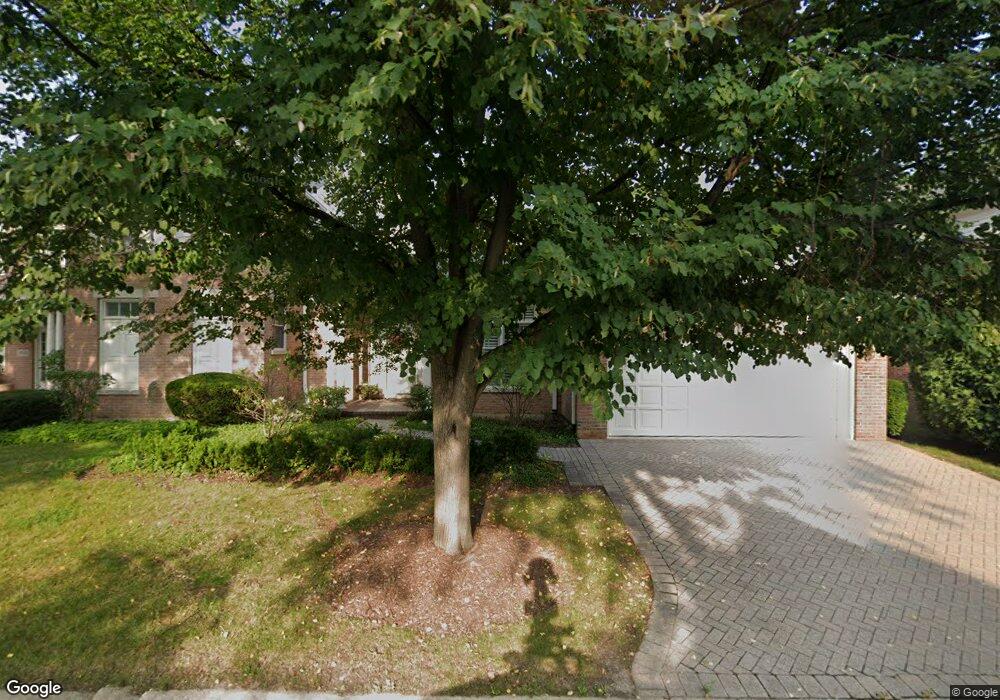
2529 E Chesapeake Place Westchester, IL 60154
Estimated Value: $634,000 - $658,000
3
Beds
3
Baths
2,740
Sq Ft
$237/Sq Ft
Est. Value
About This Home
This home is located at 2529 E Chesapeake Place, Westchester, IL 60154 and is currently estimated at $648,215, approximately $236 per square foot. 2529 E Chesapeake Place is a home located in Cook County with nearby schools including Hillside Elementary School, Proviso West High School, and Immanuel Christian Academy.
Ownership History
Date
Name
Owned For
Owner Type
Purchase Details
Closed on
Nov 27, 2019
Sold by
King Brian L and King Clelia A
Bought by
King Brian L and Brian L King Trust
Current Estimated Value
Purchase Details
Closed on
Aug 22, 2017
Sold by
Dorothy D Souza Living Trust
Bought by
King Brian L and King Clelia A
Purchase Details
Closed on
Feb 22, 2005
Sold by
Souza Dorothy D
Bought by
Souza Dorothy D and Dorothy D Souza Living Trust
Purchase Details
Closed on
Sep 21, 2000
Sold by
Lasalle Bank National Assn
Bought by
Souza John P and Souza Dorothy D
Purchase Details
Closed on
Apr 24, 1998
Sold by
Bank One Trust Company Na
Bought by
Gorsky Robert J and Gorsky Jean E Keegan
Home Financials for this Owner
Home Financials are based on the most recent Mortgage that was taken out on this home.
Original Mortgage
$25,000
Interest Rate
7.27%
Create a Home Valuation Report for This Property
The Home Valuation Report is an in-depth analysis detailing your home's value as well as a comparison with similar homes in the area
Home Values in the Area
Average Home Value in this Area
Purchase History
| Date | Buyer | Sale Price | Title Company |
|---|---|---|---|
| King Brian L | -- | Attorney | |
| King Brian L | $535,000 | Attorney | |
| Souza Dorothy D | -- | -- | |
| Souza John P | $437,000 | -- | |
| Gorsky Robert J | -- | Land Title Group Inc |
Source: Public Records
Mortgage History
| Date | Status | Borrower | Loan Amount |
|---|---|---|---|
| Previous Owner | Gorsky Robert J | $25,000 |
Source: Public Records
Tax History Compared to Growth
Tax History
| Year | Tax Paid | Tax Assessment Tax Assessment Total Assessment is a certain percentage of the fair market value that is determined by local assessors to be the total taxable value of land and additions on the property. | Land | Improvement |
|---|---|---|---|---|
| 2024 | $12,049 | $54,000 | $8,578 | $45,422 |
| 2023 | $10,812 | $54,000 | $8,578 | $45,422 |
| 2022 | $10,812 | $45,724 | $6,951 | $38,773 |
| 2021 | $10,441 | $45,724 | $6,951 | $38,773 |
| 2020 | $10,386 | $45,724 | $6,951 | $38,773 |
| 2019 | $11,412 | $50,690 | $6,359 | $44,331 |
| 2018 | $11,247 | $50,690 | $6,359 | $44,331 |
| 2017 | $13,978 | $56,098 | $6,359 | $49,739 |
| 2016 | $11,178 | $42,649 | $5,768 | $36,881 |
| 2015 | $9,844 | $42,649 | $5,768 | $36,881 |
| 2014 | $9,628 | $42,649 | $5,768 | $36,881 |
| 2013 | $9,935 | $47,056 | $5,768 | $41,288 |
Source: Public Records
Map
Nearby Homes
- 11140 Windsor Dr
- 2508 Camberley Cir Unit 1648
- 11449 Prescott Ln
- 16 Princess Ct Unit 16
- 2550 Camberley Cir Unit 5-810
- 10916 Kingston St
- 2130 Mandel Ave
- 11148 Shelley St
- 2925 Denton Ct
- 2401 Mayfair Ave
- 11157 Shaw St
- 3065 Ashton Ct
- 1948 Boeger Ave
- 2858 Kensington Ave
- 2337 Kensington Ave
- 2230 Kensington Ave
- 2205 Mayfair Ave
- 1847 Boeger Ave
- 10610 Essex St
- 2623 Sunnyside Ave
- 2525 E Chesapeake Place
- 2533 E Chesapeake Place
- 2521 E Chesapeake Place
- 2537 E Chesapeake Place
- 2537 E Chesapeake Place Unit 2537
- 2526 E Chesapeake Place
- 2530 E Chesapeake Place
- 2560 Prairie View Ct
- 11235 E Chesapeake Place
- 2534 E Chesapeake Place
- 11219 E Chesapeake Place
- 11215 E Chesapeake Place
- 11231 E Chesapeake Place
- 2570 Prairie View Ct
- 11227 E Chesapeake Place
- 11206 Prairie View Ct
- 11239 E Chesapeake Place
- 11223 E Chesapeake Place
- 11211 E Chesapeake Place
- 11252 W Alexandria Ln