2529 N Mcaree Rd Waukegan, IL 60087
Bonnie Brook NeighborhoodEstimated Value: $257,000 - $302,000
3
Beds
2
Baths
1,412
Sq Ft
$201/Sq Ft
Est. Value
About This Home
This home is located at 2529 N Mcaree Rd, Waukegan, IL 60087 and is currently estimated at $284,466, approximately $201 per square foot. 2529 N Mcaree Rd is a home located in Lake County with nearby schools including Oakdale Elementary School, Jack Benny Middle School, and Waukegan High School.
Ownership History
Date
Name
Owned For
Owner Type
Purchase Details
Closed on
Apr 19, 2002
Sold by
Kostylo Joann E and Schwarz Larry K
Bought by
Strack Mark and Strack Kristine
Current Estimated Value
Home Financials for this Owner
Home Financials are based on the most recent Mortgage that was taken out on this home.
Original Mortgage
$60,000
Interest Rate
7.07%
Purchase Details
Closed on
Oct 18, 2001
Sold by
Declaratio Kostylo Joann E and Declaratio Theresa M Henderson
Bought by
Kostylo Joann E and Schwarz Larry K
Purchase Details
Closed on
Apr 16, 1998
Sold by
Henderson Theresa M and Trust John M & Theresa M Hende
Bought by
Henderson Theresa M
Purchase Details
Closed on
Mar 24, 1997
Sold by
Henderson Theresa M and Kostylo Joann E
Bought by
Henderson John H and Henderson Theresa M
Create a Home Valuation Report for This Property
The Home Valuation Report is an in-depth analysis detailing your home's value as well as a comparison with similar homes in the area
Home Values in the Area
Average Home Value in this Area
Purchase History
| Date | Buyer | Sale Price | Title Company |
|---|---|---|---|
| Strack Mark | -- | -- | |
| Kostylo Joann E | -- | -- | |
| Declaratio Kostylo Joann E | -- | -- | |
| Henderson Theresa M | -- | -- | |
| Henderson John H | -- | -- |
Source: Public Records
Mortgage History
| Date | Status | Borrower | Loan Amount |
|---|---|---|---|
| Closed | Strack Mark | $60,000 |
Source: Public Records
Tax History Compared to Growth
Tax History
| Year | Tax Paid | Tax Assessment Tax Assessment Total Assessment is a certain percentage of the fair market value that is determined by local assessors to be the total taxable value of land and additions on the property. | Land | Improvement |
|---|---|---|---|---|
| 2024 | $6,422 | $84,383 | $17,735 | $66,648 |
| 2023 | $6,491 | $76,102 | $15,994 | $60,108 |
| 2022 | $6,491 | $72,399 | $23,930 | $48,469 |
| 2021 | $5,881 | $62,409 | $20,982 | $41,427 |
| 2020 | $5,911 | $58,141 | $19,547 | $38,594 |
| 2019 | $5,896 | $53,277 | $17,912 | $35,365 |
| 2018 | $6,730 | $58,433 | $24,555 | $33,878 |
| 2017 | $6,500 | $51,697 | $21,724 | $29,973 |
| 2016 | $5,216 | $39,755 | $16,706 | $23,049 |
| 2015 | $4,997 | $35,581 | $14,952 | $20,629 |
| 2014 | $4,225 | $30,512 | $9,783 | $20,729 |
| 2012 | $5,456 | $33,056 | $10,599 | $22,457 |
Source: Public Records
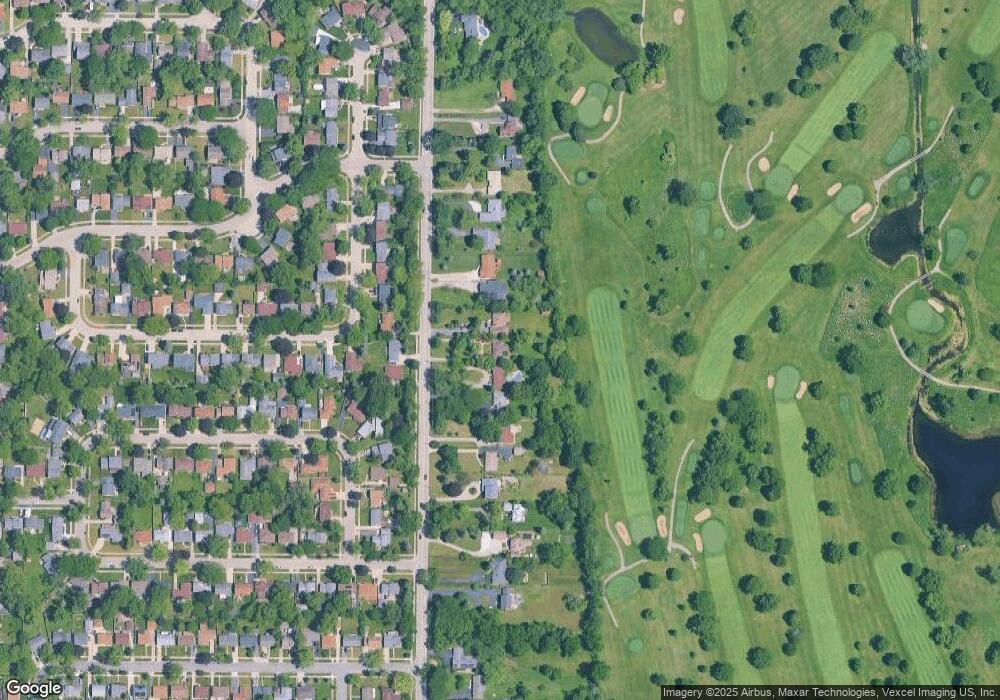
Map
Nearby Homes
- 2708 Dana Ave
- 2705 Dana Ave
- 2713 Varonen Ave
- 12312 W Audrey Ave
- 2613 N Lewis Ave
- 2350 N Lewis Ave
- 36955 N Garrick Ave
- 3101 Country Club Ln
- 3032 W Vermont Ave
- 1612 Whitney St
- 3320 Sunset Ave
- 1913 Chippewa Rd
- 2928 W Country Club Ave
- 3000 W Country Club Ave
- 2946 W Country Club Ave
- 1636 Rice St
- 2440 W Cheyenne Rd
- 3211 Rugby Ct
- 36245 N Green Bay Rd
- 2715 W Greenwood Ave
- 2543 N Mcaree Rd
- 2525 N Mcaree Rd
- 2515 N Mcaree Rd
- 2545 N Mcaree Rd
- 2547 N Mcaree Rd
- 2511 N Mcaree Rd
- 2601 N Mcaree Rd
- 2505 N Mcaree Rd
- 2520 N Mcaree Rd
- 2516 N Mcaree Rd
- 2544 N Mcaree Rd
- 2539 Roberts Ave
- 2605 N Mcaree Rd
- 2600 Brnot Ave
- 2533 Roberts Ave
- 2501 N Mcaree Rd
- 2607 Jacquelyn Ln
- 2601 Roberts Ave
- 2604 Brnot Ave
- 2509 Roberts Ave