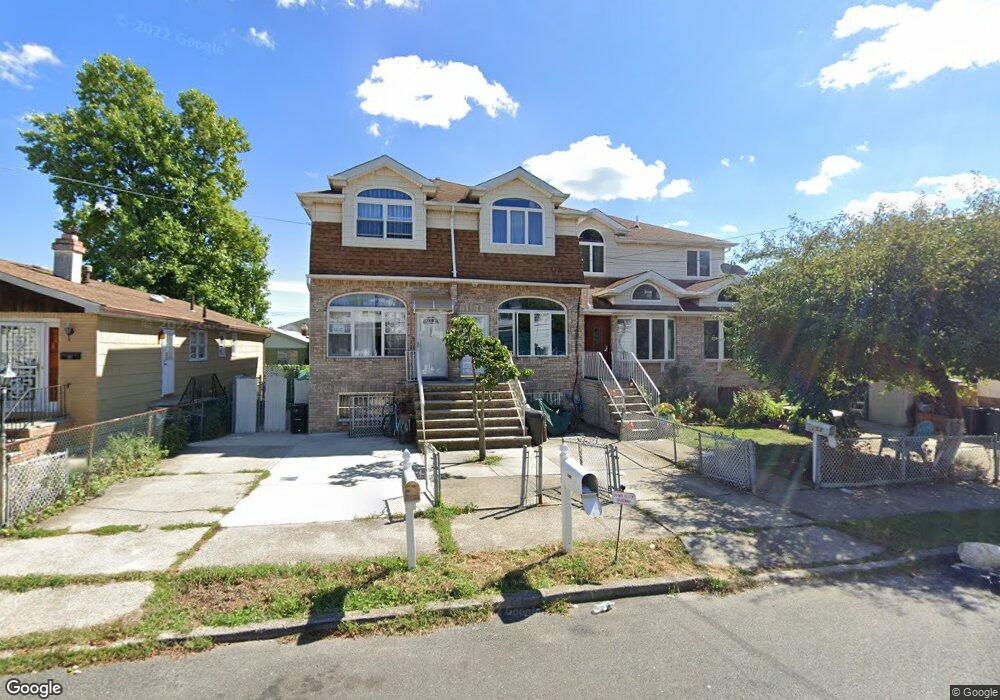
252B Titus Ave Staten Island, NY 10306
Oakwood NeighborhoodEstimated Value: $666,898 - $716,000
--
Bed
4
Baths
1,242
Sq Ft
$553/Sq Ft
Est. Value
About This Home
This home is located at 252B Titus Ave, Staten Island, NY 10306 and is currently estimated at $686,475, approximately $552 per square foot. 252B Titus Ave is a home located in Richmond County with nearby schools including P.S. 41 The Stephanie a Vierno School, Is 2 George L Egbert, and New Dorp High School.
Ownership History
Date
Name
Owned For
Owner Type
Purchase Details
Closed on
Aug 16, 2016
Sold by
Shostya Anna
Bought by
Zhang Hui Jin and Ni Ling Qing
Current Estimated Value
Home Financials for this Owner
Home Financials are based on the most recent Mortgage that was taken out on this home.
Original Mortgage
$190,000
Outstanding Balance
$155,251
Interest Rate
4.25%
Mortgage Type
Adjustable Rate Mortgage/ARM
Estimated Equity
$531,224
Purchase Details
Closed on
Jul 31, 2008
Sold by
Shostya Anna and Shostya Edward
Bought by
Shostya Anna
Create a Home Valuation Report for This Property
The Home Valuation Report is an in-depth analysis detailing your home's value as well as a comparison with similar homes in the area
Home Values in the Area
Average Home Value in this Area
Purchase History
| Date | Buyer | Sale Price | Title Company |
|---|---|---|---|
| Zhang Hui Jin | $435,000 | None Available | |
| Shostya Anna | -- | The Judicial Title Insurance |
Source: Public Records
Mortgage History
| Date | Status | Borrower | Loan Amount |
|---|---|---|---|
| Open | Zhang Hui Jin | $190,000 |
Source: Public Records
Tax History Compared to Growth
Tax History
| Year | Tax Paid | Tax Assessment Tax Assessment Total Assessment is a certain percentage of the fair market value that is determined by local assessors to be the total taxable value of land and additions on the property. | Land | Improvement |
|---|---|---|---|---|
| 2025 | $4,911 | $36,540 | $3,413 | $33,127 |
| 2024 | $4,911 | $33,660 | $3,705 | $29,955 |
| 2023 | $4,928 | $24,265 | $3,269 | $20,996 |
| 2022 | $4,570 | $36,180 | $5,100 | $31,080 |
| 2021 | $4,545 | $37,740 | $5,100 | $32,640 |
| 2020 | $4,313 | $32,580 | $5,100 | $27,480 |
| 2019 | $4,262 | $30,120 | $5,100 | $25,020 |
| 2018 | $4,122 | $20,221 | $3,951 | $16,270 |
| 2017 | $3,889 | $19,077 | $5,099 | $13,978 |
| 2016 | $3,598 | $17,998 | $4,421 | $13,577 |
| 2015 | $3,259 | $16,980 | $4,260 | $12,720 |
| 2014 | $3,259 | $16,980 | $4,260 | $12,720 |
Source: Public Records
Map
Nearby Homes