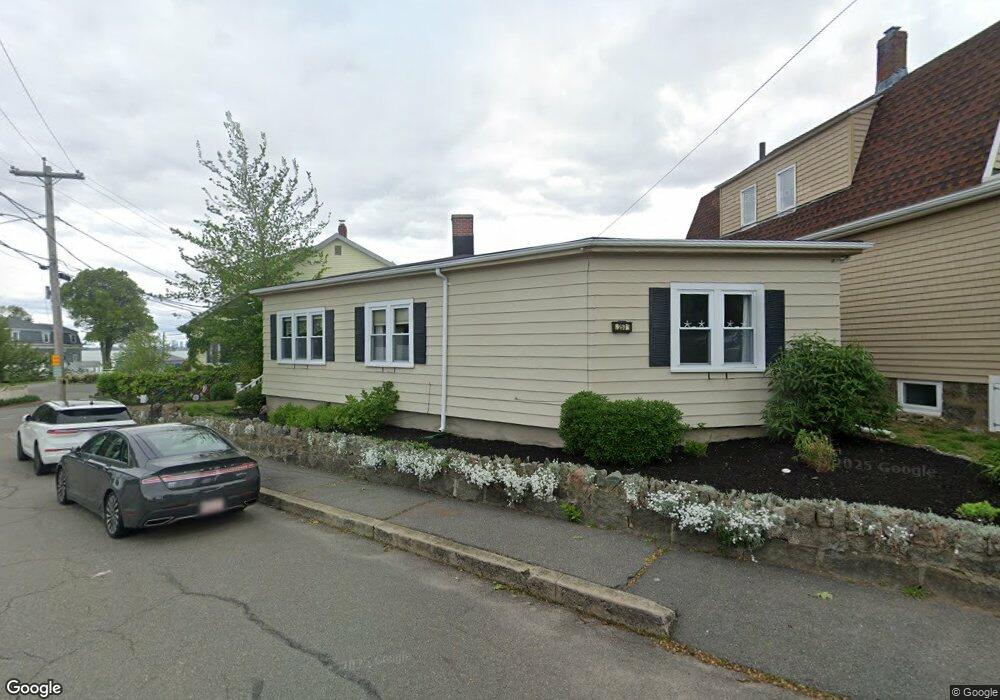
253 Castle Rd Nahant, MA 01908
Estimated Value: $641,000 - $778,000
3
Beds
2
Baths
1,335
Sq Ft
$539/Sq Ft
Est. Value
About This Home
This home is located at 253 Castle Rd, Nahant, MA 01908 and is currently estimated at $719,900, approximately $539 per square foot. 253 Castle Rd is a home located in Essex County with nearby schools including Johnson Elementary School, Swampscott Middle School, and Swampscott High School.
Ownership History
Date
Name
Owned For
Owner Type
Purchase Details
Closed on
Jul 30, 2003
Sold by
Hunter Francis P
Bought by
Christensen John T and Christensen Sheila
Current Estimated Value
Home Financials for this Owner
Home Financials are based on the most recent Mortgage that was taken out on this home.
Original Mortgage
$220,000
Outstanding Balance
$94,477
Interest Rate
5.28%
Mortgage Type
Purchase Money Mortgage
Estimated Equity
$625,423
Create a Home Valuation Report for This Property
The Home Valuation Report is an in-depth analysis detailing your home's value as well as a comparison with similar homes in the area
Home Values in the Area
Average Home Value in this Area
Purchase History
| Date | Buyer | Sale Price | Title Company |
|---|---|---|---|
| Christensen John T | $285,000 | -- | |
| Christensen John T | $285,000 | -- |
Source: Public Records
Mortgage History
| Date | Status | Borrower | Loan Amount |
|---|---|---|---|
| Open | Christensen John T | $220,000 | |
| Closed | Christensen John T | $220,000 |
Source: Public Records
Tax History Compared to Growth
Tax History
| Year | Tax Paid | Tax Assessment Tax Assessment Total Assessment is a certain percentage of the fair market value that is determined by local assessors to be the total taxable value of land and additions on the property. | Land | Improvement |
|---|---|---|---|---|
| 2025 | $5,243 | $573,000 | $369,100 | $203,900 |
| 2024 | $4,933 | $543,900 | $353,400 | $190,500 |
| 2023 | $4,399 | $483,900 | $314,100 | $169,800 |
| 2022 | $4,174 | $426,400 | $267,000 | $159,400 |
| 2021 | $4,207 | $400,300 | $251,300 | $149,000 |
| 2020 | $3,908 | $356,200 | $235,600 | $120,600 |
| 2019 | $3,436 | $314,900 | $219,900 | $95,000 |
| 2018 | $3,228 | $314,900 | $219,900 | $95,000 |
| 2017 | $3,297 | $314,900 | $219,900 | $95,000 |
| 2016 | $2,982 | $283,500 | $192,400 | $91,100 |
| 2015 | $2,945 | $269,700 | $178,600 | $91,100 |
| 2014 | $2,797 | $253,600 | $162,500 | $91,100 |
Source: Public Records
Map
Nearby Homes
- 17 Pearl Rd
- 43 Maple Ave
- 23 Phillips Rd
- 2 Goddard Dr
- 183 Bass Point Rd
- 9 Little Nahant Rd
- 303 Nahant Rd
- 66 Ocean St
- 36 Lennox Rd
- 51 Cliff St
- 3 Cliff St
- 53 Lancaster Ave
- 1 Carey Cir Unit 409
- 16 Blanchard Ave
- 31 Mills Ave
- 474 Revere Beach Blvd Unit 501
- 474 Revere Beach Blvd Unit 903
- 474 Revere Beach Blvd Unit 702
- 474 Revere Beach Blvd Unit 403
- 98 Lynnway Unit 102