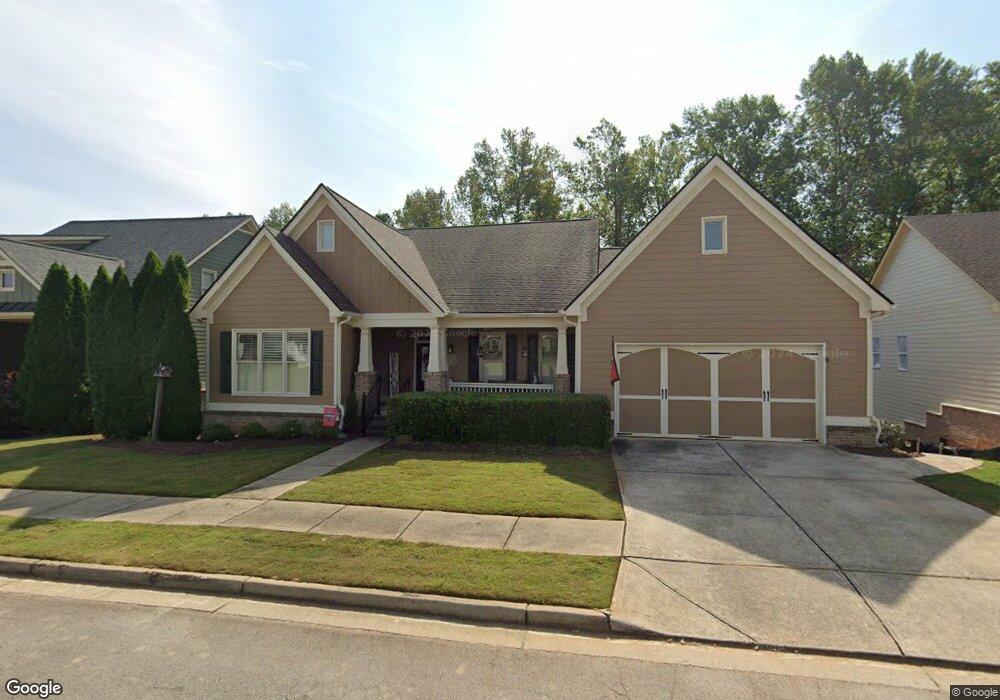
253 Chestnut Chase Hoschton, GA 30548
Estimated Value: $399,000 - $441,274
3
Beds
2
Baths
1,898
Sq Ft
$219/Sq Ft
Est. Value
About This Home
This home is located at 253 Chestnut Chase, Hoschton, GA 30548 and is currently estimated at $415,319, approximately $218 per square foot. 253 Chestnut Chase is a home located in Jackson County with nearby schools including West Jackson Elementary School, West Jackson Middle School, and Jackson County High School.
Ownership History
Date
Name
Owned For
Owner Type
Purchase Details
Closed on
Mar 11, 2019
Sold by
Jordan Tracy L
Bought by
Jordan Tracy L and Waites Samuel Phillip
Current Estimated Value
Purchase Details
Closed on
Mar 20, 2009
Sold by
Equity Resource Partners I
Bought by
Jordan Tracey L
Home Financials for this Owner
Home Financials are based on the most recent Mortgage that was taken out on this home.
Original Mortgage
$160,000
Interest Rate
5.1%
Mortgage Type
New Conventional
Purchase Details
Closed on
Dec 31, 2008
Sold by
Not Provided
Bought by
Jordan Tracy L
Purchase Details
Closed on
Sep 2, 2008
Sold by
Not Provided
Bought by
Jordan Tracy L
Purchase Details
Closed on
Apr 21, 2006
Sold by
Not Provided
Bought by
Jordan Tracy L
Purchase Details
Closed on
Dec 27, 2005
Sold by
Gary
Bought by
Tomter Inc
Purchase Details
Closed on
Apr 19, 2005
Sold by
Gary
Bought by
Tomter Inc
Create a Home Valuation Report for This Property
The Home Valuation Report is an in-depth analysis detailing your home's value as well as a comparison with similar homes in the area
Home Values in the Area
Average Home Value in this Area
Purchase History
| Date | Buyer | Sale Price | Title Company |
|---|---|---|---|
| Jordan Tracy L | $200,000 | -- | |
| Jordan Tracey L | $200,000 | -- | |
| Jordan Tracy L | $156,831 | -- | |
| Equity Resource Partners Ii Ll | $945,000 | -- | |
| Jordan Tracy L | $213,233 | -- | |
| Jordan Tracy L | $52,000 | -- | |
| Tomter Inc | -- | -- | |
| Tomter Inc | -- | -- |
Source: Public Records
Mortgage History
| Date | Status | Borrower | Loan Amount |
|---|---|---|---|
| Previous Owner | Jordan Tracey L | $160,000 |
Source: Public Records
Tax History Compared to Growth
Tax History
| Year | Tax Paid | Tax Assessment Tax Assessment Total Assessment is a certain percentage of the fair market value that is determined by local assessors to be the total taxable value of land and additions on the property. | Land | Improvement |
|---|---|---|---|---|
| 2024 | $5,023 | $161,040 | $25,000 | $136,040 |
| 2023 | $5,023 | $146,480 | $25,000 | $121,480 |
| 2022 | $4,545 | $128,120 | $25,000 | $103,120 |
| 2021 | $3,857 | $121,120 | $18,000 | $103,120 |
| 2020 | $3,524 | $102,040 | $18,000 | $84,040 |
| 2019 | $3,587 | $102,040 | $18,000 | $84,040 |
| 2018 | $3,473 | $98,000 | $18,000 | $80,000 |
| 2017 | $3,125 | $87,706 | $18,000 | $69,706 |
| 2016 | $2,993 | $83,747 | $17,360 | $66,387 |
| 2015 | $2,661 | $74,387 | $8,000 | $66,387 |
| 2014 | $2,549 | $72,694 | $8,000 | $64,694 |
| 2013 | -- | $68,165 | $8,000 | $60,165 |
Source: Public Records
Map
Nearby Homes
- 231 Chestnut Chase
- 269 Chestnut Chase
- 242 Chestnut Chase
- 209 Chestnut Chase
- 209 Chestnut Chase Unit 45
- 266 Chestnut Chase
- 275 Chestnut Chase Unit LOT 49
- 275 Chestnut Chase
- 275 Chestnut Chase Unit 48
- 218 Chestnut Chase
- 278 Chestnut Chase
- 90 Dove Trail
- 287 Chestnut Chase Unit LOT 50
- 287 Chestnut Chase
- 197 Chestnut Chase
- 194 Chestnut Chase
- 290 Chestnut Chase
- 120 Butternut Walk
- 295 Chestnut Chase Unit LOT 51
- 295 Chestnut Chase