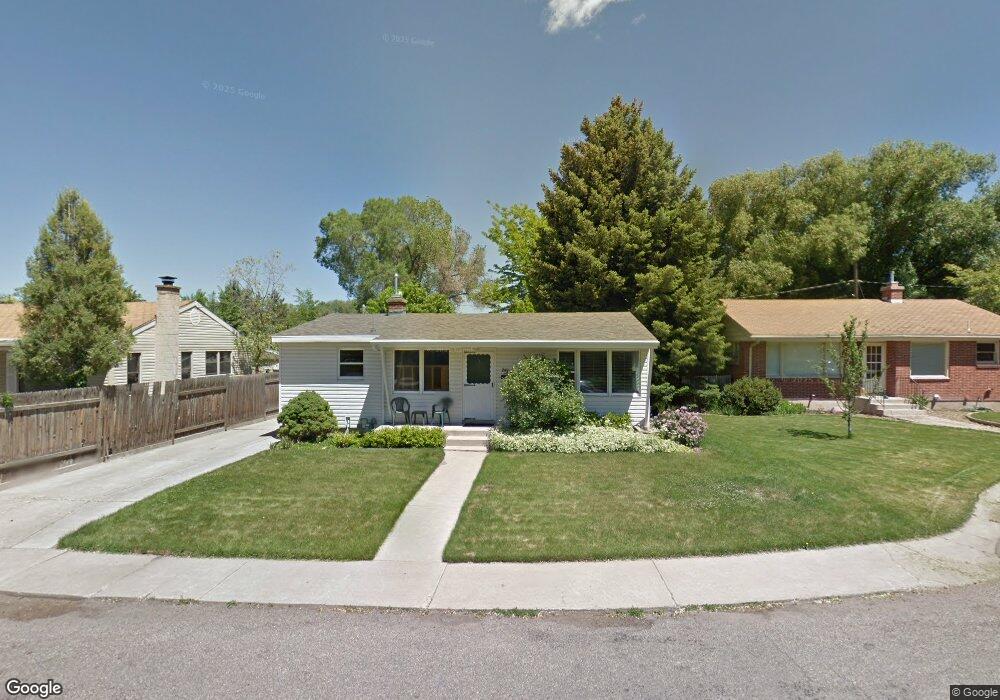
253 Chestnut Ln Logan, UT 84321
Adams NeighborhoodEstimated Value: $364,000 - $396,000
3
Beds
2
Baths
1,900
Sq Ft
$203/Sq Ft
Est. Value
About This Home
This home is located at 253 Chestnut Ln, Logan, UT 84321 and is currently estimated at $385,873, approximately $203 per square foot. 253 Chestnut Ln is a home located in Cache County with nearby schools including Adams Elementary School, Mount Logan Middle School, and Logan High School.
Ownership History
Date
Name
Owned For
Owner Type
Purchase Details
Closed on
Sep 15, 2020
Sold by
Davies Melissa Miller and Davies Christian Keith
Bought by
Davies Melissa Miller and Davies Christian Keith
Current Estimated Value
Purchase Details
Closed on
Mar 13, 2020
Sold by
Hansen Rayann and Alder Suzette
Bought by
Davies Melissa Miller and Davies Christian Keith
Home Financials for this Owner
Home Financials are based on the most recent Mortgage that was taken out on this home.
Original Mortgage
$220,500
Outstanding Balance
$194,864
Interest Rate
3.5%
Mortgage Type
New Conventional
Estimated Equity
$191,009
Create a Home Valuation Report for This Property
The Home Valuation Report is an in-depth analysis detailing your home's value as well as a comparison with similar homes in the area
Home Values in the Area
Average Home Value in this Area
Purchase History
| Date | Buyer | Sale Price | Title Company |
|---|---|---|---|
| Davies Melissa Miller | -- | Stewart Title Ins Agcy Of Ut | |
| Davies Melissa Miller | -- | American Secure Title Logan |
Source: Public Records
Mortgage History
| Date | Status | Borrower | Loan Amount |
|---|---|---|---|
| Open | Davies Melissa Miller | $220,500 |
Source: Public Records
Tax History
| Year | Tax Paid | Tax Assessment Tax Assessment Total Assessment is a certain percentage of the fair market value that is determined by local assessors to be the total taxable value of land and additions on the property. | Land | Improvement |
|---|---|---|---|---|
| 2025 | $1,818 | $235,070 | $0 | $0 |
| 2024 | $1,877 | $235,070 | $0 | $0 |
| 2023 | $1,959 | $233,860 | $0 | $0 |
| 2022 | $196 | $219,055 | $0 | $0 |
| 2021 | $1,780 | $306,690 | $45,000 | $261,690 |
| 2020 | $1,589 | $246,300 | $45,000 | $201,300 |
| 2019 | $1,329 | $197,100 | $45,000 | $152,100 |
| 2018 | $1,201 | $162,600 | $45,000 | $117,600 |
| 2017 | $1,091 | $78,100 | $0 | $0 |
| 2016 | $1,131 | $78,100 | $0 | $0 |
| 2015 | $1,132 | $78,100 | $0 | $0 |
| 2014 | $1,023 | $78,100 | $0 | $0 |
| 2013 | -- | $63,875 | $0 | $0 |
Source: Public Records
Map
Nearby Homes
Your Personal Tour Guide
Ask me questions while you tour the home.