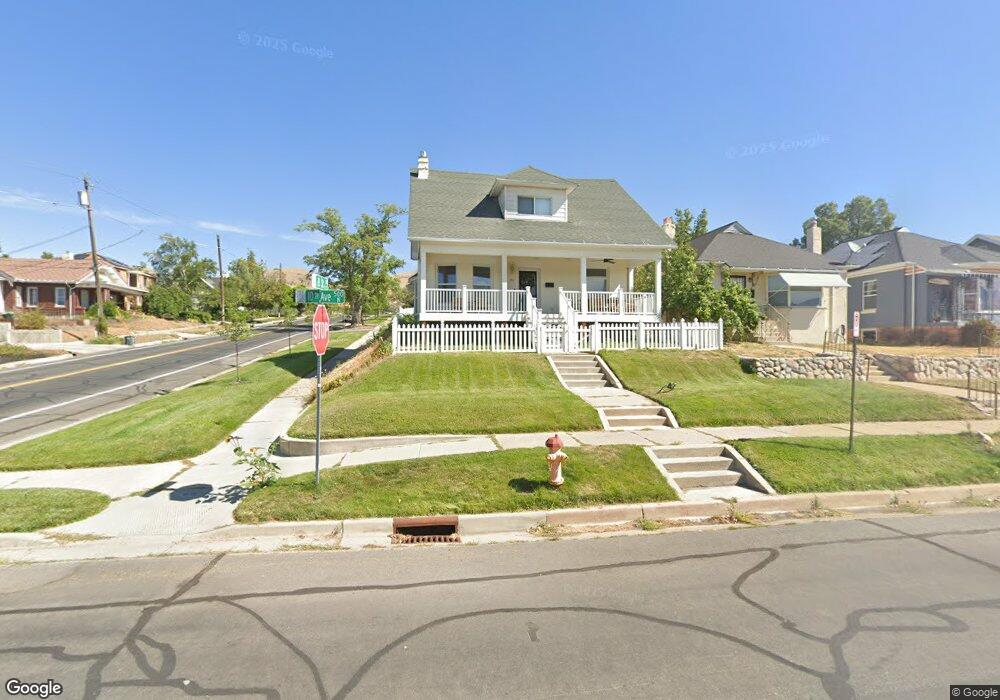
253 E 10th Ave Salt Lake City, UT 84103
The Avenues NeighborhoodEstimated Value: $918,000 - $1,379,000
4
Beds
3
Baths
2,691
Sq Ft
$389/Sq Ft
Est. Value
About This Home
This home is located at 253 E 10th Ave, Salt Lake City, UT 84103 and is currently estimated at $1,045,922, approximately $388 per square foot. 253 E 10th Ave is a home located in Salt Lake County with nearby schools including Ensign School, West High, and Open Classroom.
Ownership History
Date
Name
Owned For
Owner Type
Purchase Details
Closed on
Feb 4, 2010
Sold by
Whittaker Eric
Bought by
Kalisz Patrick
Current Estimated Value
Home Financials for this Owner
Home Financials are based on the most recent Mortgage that was taken out on this home.
Original Mortgage
$316,167
Outstanding Balance
$214,110
Interest Rate
5.5%
Mortgage Type
FHA
Estimated Equity
$831,812
Purchase Details
Closed on
Jun 23, 2005
Sold by
Holman Kevin G and Holman Marla A
Bought by
Whittaker Eric L
Home Financials for this Owner
Home Financials are based on the most recent Mortgage that was taken out on this home.
Original Mortgage
$287,900
Interest Rate
1%
Mortgage Type
Fannie Mae Freddie Mac
Purchase Details
Closed on
Dec 19, 2003
Sold by
Holman Kevin G and Holman Marla
Bought by
Holman Kevin G and Holman Marla A
Purchase Details
Closed on
May 16, 2002
Sold by
Penrod April Darlene Schick and Schick Christopher Smith Rogers
Bought by
Holman Kevin G and Holman Marla
Create a Home Valuation Report for This Property
The Home Valuation Report is an in-depth analysis detailing your home's value as well as a comparison with similar homes in the area
Home Values in the Area
Average Home Value in this Area
Purchase History
| Date | Buyer | Sale Price | Title Company |
|---|---|---|---|
| Kalisz Patrick | -- | Advantage Title Cottonwood | |
| Whittaker Eric L | -- | Advantage Title Cottonwood | |
| Holman Kevin G | -- | -- | |
| Holman Kevin G | -- | Township Title |
Source: Public Records
Mortgage History
| Date | Status | Borrower | Loan Amount |
|---|---|---|---|
| Open | Kalisz Patrick | $316,167 | |
| Previous Owner | Whittaker Eric L | $287,900 |
Source: Public Records
Tax History Compared to Growth
Tax History
| Year | Tax Paid | Tax Assessment Tax Assessment Total Assessment is a certain percentage of the fair market value that is determined by local assessors to be the total taxable value of land and additions on the property. | Land | Improvement |
|---|---|---|---|---|
| 2025 | $3,938 | $848,700 | $221,700 | $627,000 |
| 2024 | $3,938 | $751,300 | $211,600 | $539,700 |
| 2023 | $3,807 | $700,100 | $203,500 | $496,600 |
| 2022 | $4,005 | $691,000 | $199,500 | $491,500 |
| 2021 | $3,799 | $593,500 | $161,900 | $431,600 |
| 2020 | $3,631 | $539,900 | $151,300 | $388,600 |
| 2019 | $3,476 | $486,300 | $137,600 | $348,700 |
| 2018 | $3,527 | $480,500 | $137,600 | $342,900 |
| 2017 | $3,468 | $442,600 | $137,600 | $305,000 |
| 2016 | $3,118 | $377,900 | $121,100 | $256,800 |
| 2015 | $3,486 | $400,500 | $118,600 | $281,900 |
| 2014 | $3,319 | $378,200 | $118,600 | $259,600 |
Source: Public Records
Map
Nearby Homes
- 288 E 10th Ave
- 590 N Capitol Park Ave
- 464 D St
- 375 E 9th Ave
- 400 E Capitol Park Ave Unit 203
- 619 Cortez St
- 692 Cortez St
- 724 E Capitol Blvd
- 719 N Eastcapitol Blvd
- 265 N Center St
- 265 N "C" St
- 68 E Columbus Ct
- 265 E 5th Ave
- 605 N De Soto St
- 819 N Juniperpoint Dr
- 822 N Grandridge Ct Unit 49C
- 825 N Juniperpoint Ct
- 229 N B St Unit 9
- 240 N Spencer Ct
- 532 E 12th Ave