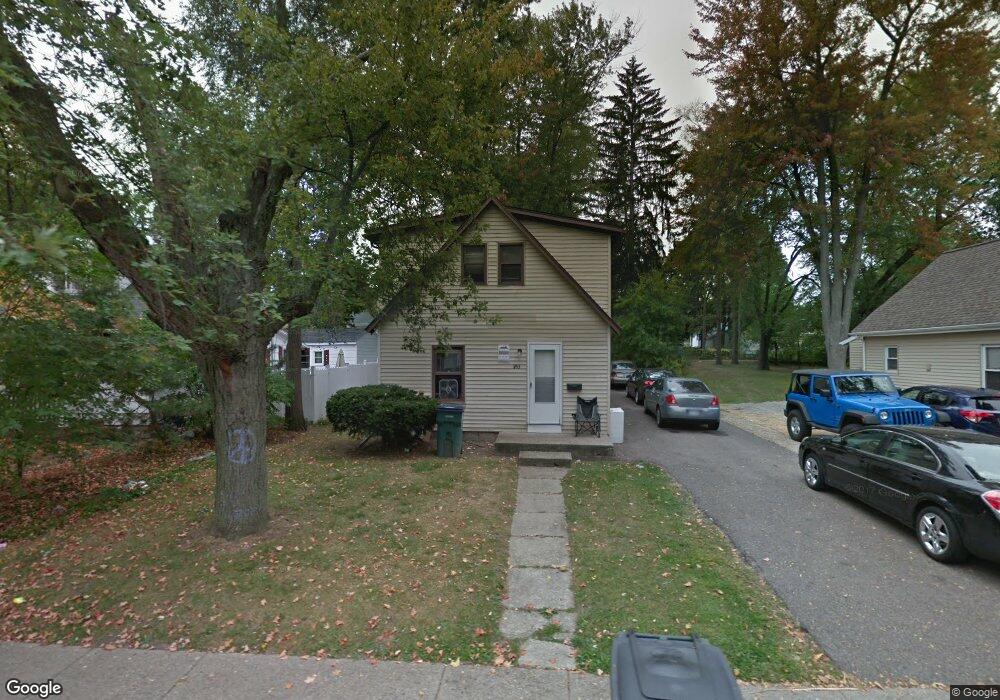
253 Gunson St East Lansing, MI 48823
Estimated Value: $303,000 - $342,000
5
Beds
2
Baths
1,616
Sq Ft
$202/Sq Ft
Est. Value
About This Home
This home is located at 253 Gunson St, East Lansing, MI 48823 and is currently estimated at $326,793, approximately $202 per square foot. 253 Gunson St is a home located in Ingham County with nearby schools including Marble Elementary School, MacDonald Middle School, and East Lansing High School.
Ownership History
Date
Name
Owned For
Owner Type
Purchase Details
Closed on
Aug 19, 2009
Sold by
Mulholland James C and Mulholland Melanie K
Bought by
Jg & Jw Investment Properties Llc
Current Estimated Value
Home Financials for this Owner
Home Financials are based on the most recent Mortgage that was taken out on this home.
Original Mortgage
$4,050,000
Interest Rate
5.28%
Mortgage Type
Purchase Money Mortgage
Purchase Details
Closed on
Oct 1, 1988
Purchase Details
Closed on
Dec 1, 1980
Create a Home Valuation Report for This Property
The Home Valuation Report is an in-depth analysis detailing your home's value as well as a comparison with similar homes in the area
Home Values in the Area
Average Home Value in this Area
Purchase History
| Date | Buyer | Sale Price | Title Company |
|---|---|---|---|
| Jg & Jw Investment Properties Llc | $4,892,000 | Tri Title Agency Llc | |
| -- | $54,000 | -- | |
| -- | $43,500 | -- |
Source: Public Records
Mortgage History
| Date | Status | Borrower | Loan Amount |
|---|---|---|---|
| Closed | Jg & Jw Investment Properties Llc | $4,050,000 |
Source: Public Records
Tax History Compared to Growth
Tax History
| Year | Tax Paid | Tax Assessment Tax Assessment Total Assessment is a certain percentage of the fair market value that is determined by local assessors to be the total taxable value of land and additions on the property. | Land | Improvement |
|---|---|---|---|---|
| 2025 | $7,234 | $171,200 | $24,400 | $146,800 |
| 2024 | $63 | $164,400 | $22,600 | $141,800 |
| 2023 | $6,788 | $151,400 | $20,000 | $131,400 |
| 2022 | $6,494 | $134,800 | $18,000 | $116,800 |
| 2021 | $6,359 | $131,500 | $16,000 | $115,500 |
| 2020 | $6,285 | $105,000 | $16,400 | $88,600 |
| 2019 | $6,062 | $93,300 | $18,600 | $74,700 |
| 2018 | $6,451 | $90,600 | $17,800 | $72,800 |
| 2017 | $6,223 | $87,900 | $20,100 | $67,800 |
| 2016 | -- | $86,200 | $20,000 | $66,200 |
| 2015 | -- | $80,600 | $38,577 | $42,023 |
| 2014 | -- | $76,800 | $38,301 | $38,499 |
Source: Public Records
Map
Nearby Homes
- 15403 Short St
- 704 Beech St
- 696 Beech St
- 1124 Burcham Dr
- 586 Lexington Ave
- 353 Division St
- 1550 Ann St
- 220 Mac Ave Unit 302
- 235 Maplewood Dr
- 933 Bedford Rd
- 688 Moorland Dr Unit 9
- 408 Whitehills Dr
- 753 E Saginaw St
- 1719 Woodside Dr
- 351 Oakhill Ave Unit 207
- 1544 Haslett Rd
- 904 Sunset Ln
- 415 W Grand River Ave
- 1351 Foxcroft Rd
- 815 Westlawn Ave
- 255 Gunson St
- 251 Gunson St
- 1005 Albert Ave
- 275 Gunson St
- 1001 Albert Ave
- 1001 Albert St
- 1001 E Albert Avevue
- 277 Gunson St
- 237 Gunson St
- 266 Durand St
- 1006 Albert Ave Unit 1008
- 258 Gunson St
- 252 Gunson St
- 264 Gunson St
- 1002 Albert St
- 285 Gunson St
- 233 Gunson St
- 256 Durand St
- 274 Durand St
- 1002 Albert Ave