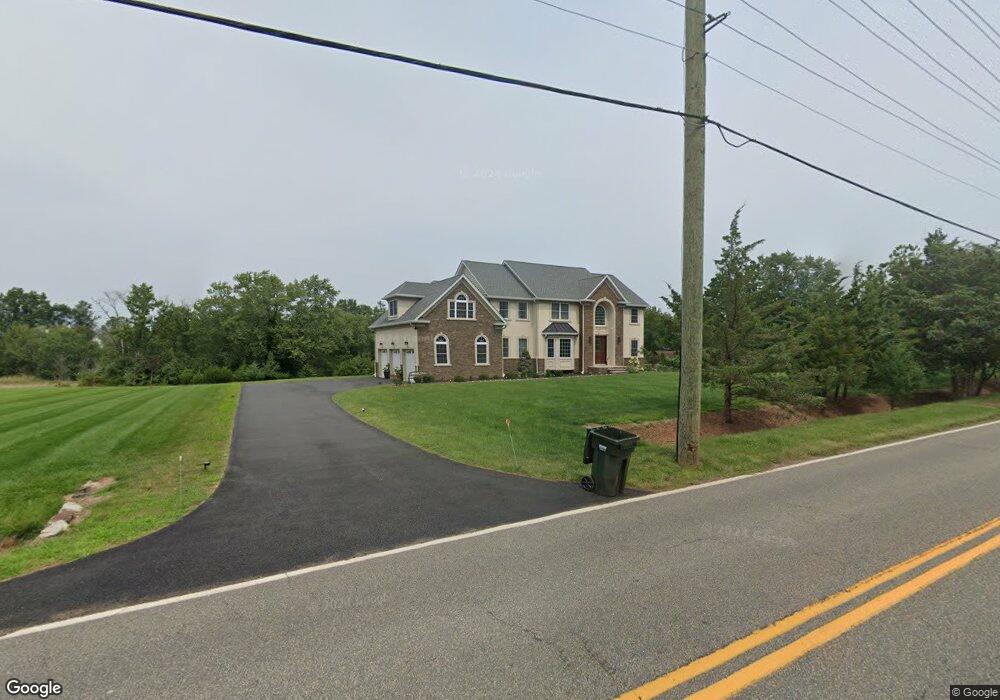
253 Hillsborough Rd Hillsborough Township, NJ 08844
Estimated Value: $1,231,000 - $1,355,000
5
Beds
5
Baths
4,050
Sq Ft
$317/Sq Ft
Est. Value
About This Home
This home is located at 253 Hillsborough Rd, Hillsborough Township, NJ 08844 and is currently estimated at $1,284,506, approximately $317 per square foot. 253 Hillsborough Rd is a home located in Somerset County with nearby schools including Hillsborough High School and Brighthorizons at Hillsborough.
Ownership History
Date
Name
Owned For
Owner Type
Purchase Details
Closed on
Oct 8, 2020
Sold by
Zp Builders Llc
Bought by
Khirsariya Neel and Khirsariya Nidhi
Current Estimated Value
Home Financials for this Owner
Home Financials are based on the most recent Mortgage that was taken out on this home.
Original Mortgage
$719,600
Outstanding Balance
$640,046
Interest Rate
2.9%
Mortgage Type
New Conventional
Estimated Equity
$644,460
Purchase Details
Closed on
Aug 1, 2018
Sold by
Hart Development Llc
Bought by
Zp Builders Llc
Create a Home Valuation Report for This Property
The Home Valuation Report is an in-depth analysis detailing your home's value as well as a comparison with similar homes in the area
Home Values in the Area
Average Home Value in this Area
Purchase History
| Date | Buyer | Sale Price | Title Company |
|---|---|---|---|
| Khirsariya Neel | $899,500 | Presidential Title Agcy Inc | |
| Zp Builders Llc | $220,000 | Multiple |
Source: Public Records
Mortgage History
| Date | Status | Borrower | Loan Amount |
|---|---|---|---|
| Open | Khirsariya Neel | $719,600 |
Source: Public Records
Tax History Compared to Growth
Tax History
| Year | Tax Paid | Tax Assessment Tax Assessment Total Assessment is a certain percentage of the fair market value that is determined by local assessors to be the total taxable value of land and additions on the property. | Land | Improvement |
|---|---|---|---|---|
| 2025 | $18,805 | $956,300 | $313,100 | $643,200 |
| 2024 | $18,805 | $877,500 | $275,600 | $601,900 |
| 2023 | $18,285 | $849,300 | $244,400 | $604,900 |
| 2022 | $18,860 | $844,600 | $232,900 | $611,700 |
| 2021 | $4,332 | $200,600 | $200,600 | $0 |
| 2020 | $4,337 | $181,900 | $181,900 | $0 |
| 2019 | $4,373 | $181,900 | $181,900 | $0 |
| 2018 | $3,643 | $150,600 | $150,600 | $0 |
| 2017 | $3,275 | $135,600 | $135,600 | $0 |
| 2016 | $3,153 | $130,600 | $130,600 | $0 |
| 2015 | $2,646 | $111,000 | $111,000 | $0 |
| 2014 | $3,653 | $156,500 | $156,500 | $0 |
Source: Public Records
Map
Nearby Homes