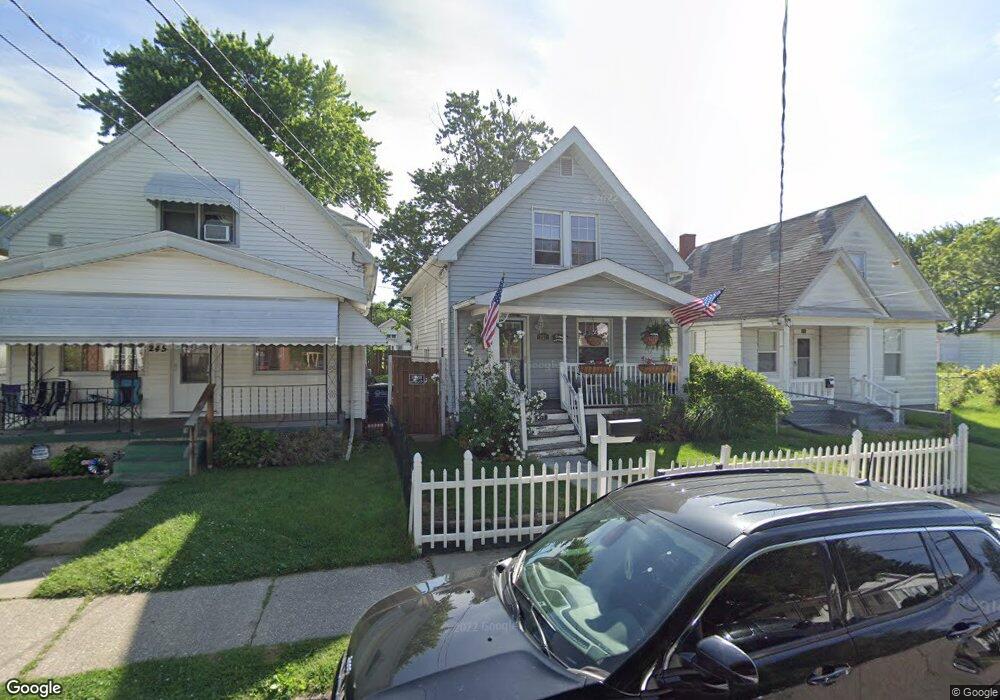
253 Licking St Toledo, OH 43605
East Toledo NeighborhoodEstimated Value: $56,000 - $81,000
3
Beds
1
Bath
936
Sq Ft
$75/Sq Ft
Est. Value
About This Home
This home is located at 253 Licking St, Toledo, OH 43605 and is currently estimated at $70,167, approximately $74 per square foot. 253 Licking St is a home located in Lucas County with nearby schools including Garfield Elementary School, Waite High School, and Kenmore Preparatory Academy dba Toledo Preparatory Academy.
Ownership History
Date
Name
Owned For
Owner Type
Purchase Details
Closed on
Mar 3, 2015
Sold by
Vasko John A
Bought by
Vasko Sabrina E
Current Estimated Value
Purchase Details
Closed on
Jan 24, 2005
Sold by
Barker Sue E and Barker Roger L
Bought by
Vasko John A and Vasko Sabrina E
Home Financials for this Owner
Home Financials are based on the most recent Mortgage that was taken out on this home.
Original Mortgage
$12,535
Interest Rate
5.79%
Mortgage Type
Purchase Money Mortgage
Create a Home Valuation Report for This Property
The Home Valuation Report is an in-depth analysis detailing your home's value as well as a comparison with similar homes in the area
Home Values in the Area
Average Home Value in this Area
Purchase History
| Date | Buyer | Sale Price | Title Company |
|---|---|---|---|
| Vasko Sabrina E | -- | None Available | |
| Vasko John A | $15,000 | Northwest Title Agency Of Oh |
Source: Public Records
Mortgage History
| Date | Status | Borrower | Loan Amount |
|---|---|---|---|
| Closed | Vasko John A | $12,535 |
Source: Public Records
Tax History Compared to Growth
Tax History
| Year | Tax Paid | Tax Assessment Tax Assessment Total Assessment is a certain percentage of the fair market value that is determined by local assessors to be the total taxable value of land and additions on the property. | Land | Improvement |
|---|---|---|---|---|
| 2024 | $557 | $15,925 | $4,480 | $11,445 |
| 2023 | $881 | $12,320 | $4,025 | $8,295 |
| 2022 | $878 | $12,320 | $4,025 | $8,295 |
| 2021 | $874 | $12,320 | $4,025 | $8,295 |
| 2020 | $841 | $10,150 | $3,325 | $6,825 |
| 2019 | $811 | $10,150 | $3,325 | $6,825 |
| 2018 | $832 | $10,150 | $3,325 | $6,825 |
| 2017 | $904 | $10,710 | $3,045 | $7,665 |
| 2016 | $883 | $30,600 | $8,700 | $21,900 |
| 2015 | $852 | $30,600 | $8,700 | $21,900 |
| 2014 | $674 | $10,720 | $3,050 | $7,670 |
| 2013 | $674 | $10,720 | $3,050 | $7,670 |
Source: Public Records
Map
Nearby Homes
- 1421 N Ravine Pkwy
- 230 Elgin Ave
- 225 Maryland Ave
- 215 Maryland Ave
- 1418 Mott Ave
- 1320 Mott Ave
- 1539 Mott Ave
- 132 Elgin Ave
- 218 White St
- 111 E Broadway St
- 1620 Denver Ave
- 1326 Kelsey Ave
- 1525 Kelsey Ave
- 291 E Broadway St
- 302 Parker Ave
- 804 6th St
- 332 Willard St
- 325 E Broadway St
- 334 Willard St
- 349 Parker Ave