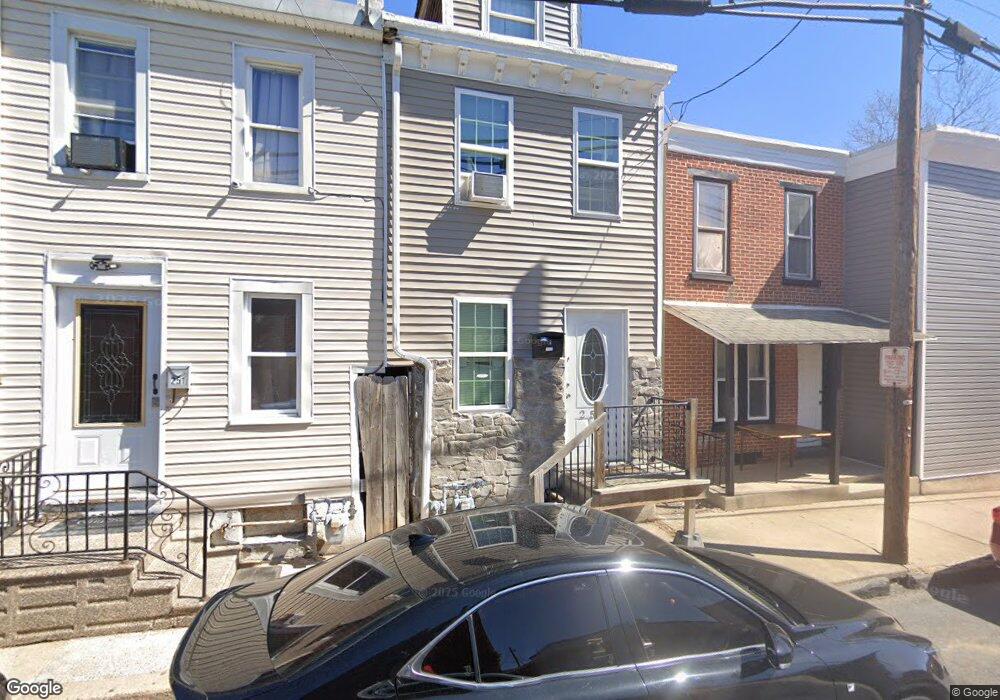
253 Maple St Reading, PA 19602
Southeast Community NeighborhoodEstimated Value: $96,889 - $130,000
3
Beds
1
Bath
996
Sq Ft
$110/Sq Ft
Est. Value
About This Home
This home is located at 253 Maple St, Reading, PA 19602 and is currently estimated at $109,722, approximately $110 per square foot. 253 Maple St is a home located in Berks County with nearby schools including Amanda E. Stout Elementary School, Southern Middle School, and Reading Senior High School.
Ownership History
Date
Name
Owned For
Owner Type
Purchase Details
Closed on
May 13, 2021
Sold by
Rosario Miranda Franni Rafael
Bought by
Bridges Jordan Tyler
Current Estimated Value
Purchase Details
Closed on
Dec 4, 2020
Sold by
Reyes Yeni M Nunez
Bought by
Miranda Franni R Rosario
Purchase Details
Closed on
Oct 18, 2018
Sold by
Sierra Mejia Ana L
Bought by
Reyes Yeni M Nunez
Purchase Details
Closed on
Jul 11, 2014
Sold by
Milligan Group Llc
Bought by
Izuchukwu Godwin
Purchase Details
Closed on
May 22, 2014
Sold by
Castillo Juan
Bought by
Milligan Group Llc
Purchase Details
Closed on
Aug 30, 2011
Sold by
Search & Find Canine Detection Inc
Bought by
Castillo Juan
Create a Home Valuation Report for This Property
The Home Valuation Report is an in-depth analysis detailing your home's value as well as a comparison with similar homes in the area
Home Values in the Area
Average Home Value in this Area
Purchase History
| Date | Buyer | Sale Price | Title Company |
|---|---|---|---|
| Bridges Jordan Tyler | $28,500 | Abes Abstract Llc | |
| Miranda Franni R Rosario | $7,000 | Conestoga Title Company | |
| Reyes Yeni M Nunez | $2,000 | None Available | |
| Izuchukwu Godwin | $2,000 | None Available | |
| Milligan Group Llc | $356 | None Available | |
| Castillo Juan | $4,000 | None Available |
Source: Public Records
Mortgage History
| Date | Status | Borrower | Loan Amount |
|---|---|---|---|
| Closed | Milligan Group Llc | $0 |
Source: Public Records
Tax History
| Year | Tax Paid | Tax Assessment Tax Assessment Total Assessment is a certain percentage of the fair market value that is determined by local assessors to be the total taxable value of land and additions on the property. | Land | Improvement |
|---|---|---|---|---|
| 2025 | $366 | $13,500 | $6,600 | $6,900 |
| 2024 | $242 | $13,500 | $6,600 | $6,900 |
| 2023 | $590 | $13,500 | $6,600 | $6,900 |
| 2022 | $590 | $13,500 | $6,600 | $6,900 |
| 2021 | $590 | $13,500 | $6,600 | $6,900 |
| 2020 | $584 | $13,500 | $6,600 | $6,900 |
| 2019 | $584 | $13,500 | $6,600 | $6,900 |
| 2018 | $584 | $13,500 | $6,600 | $6,900 |
| 2017 | $580 | $13,500 | $6,600 | $6,900 |
| 2016 | $332 | $13,500 | $6,600 | $6,900 |
| 2015 | $332 | $13,500 | $6,600 | $6,900 |
| 2014 | $305 | $13,500 | $6,600 | $6,900 |
Source: Public Records
Map
Nearby Homes
- 237 Maple St
- 1121 Spruce St
- 1047 Muhlenberg St
- 1045 Chestnut St
- 1119 Muhlenberg St
- 234 Orange St
- 226 S 12th St
- 123 S 10th St
- 1035 Cotton St
- 1047 Cotton St
- 431 S 11th St
- 1159 Muhlenberg St
- 144 S 12th St
- 427 Wunder St
- 1135 Cotton St
- 341 S 9th St
- 508 S 11th St
- 1163 Cotton St
- 519 S 11th St
- 526 S 11th St
Your Personal Tour Guide
Ask me questions while you tour the home.