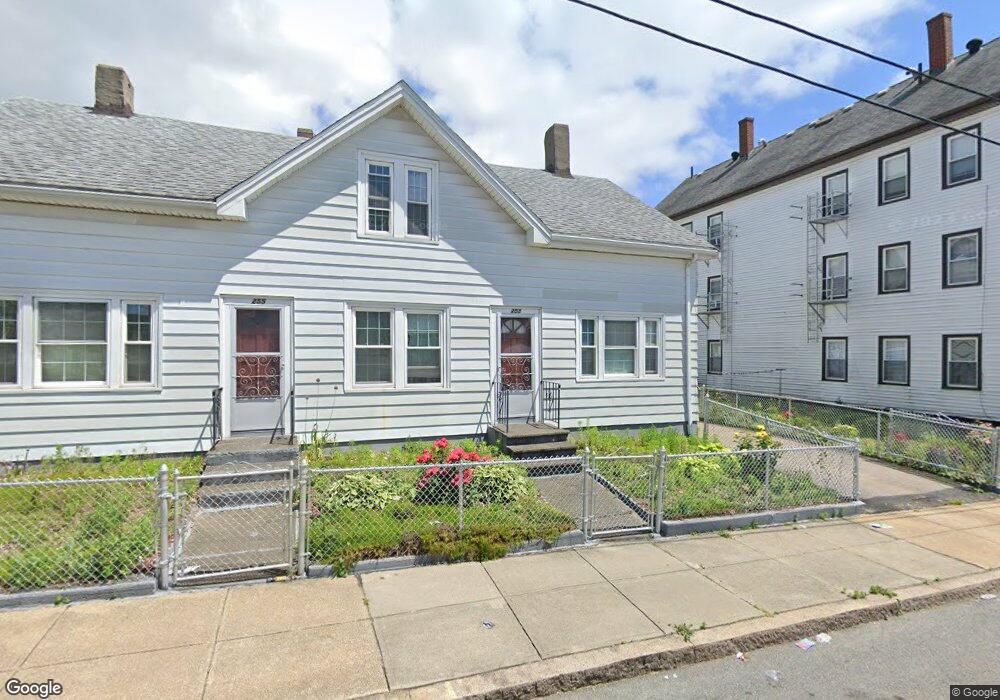
253 Orange St Fall River, MA 02720
Oak Grove Village NeighborhoodEstimated Value: $399,000 - $528,000
6
Beds
2
Baths
1,639
Sq Ft
$280/Sq Ft
Est. Value
About This Home
This home is located at 253 Orange St, Fall River, MA 02720 and is currently estimated at $459,185, approximately $280 per square foot. 253 Orange St is a home located in Bristol County with nearby schools including Mary Fonseca Elementary School, Morton Middle School, and B M C Durfee High School.
Ownership History
Date
Name
Owned For
Owner Type
Purchase Details
Closed on
May 20, 2025
Sold by
Resendes Maria
Bought by
Maria L Resendes Irt and Resendes
Current Estimated Value
Purchase Details
Closed on
Jun 6, 2023
Sold by
Reesendes Maria
Bought by
Resendes Ret Truts and Resendes R
Create a Home Valuation Report for This Property
The Home Valuation Report is an in-depth analysis detailing your home's value as well as a comparison with similar homes in the area
Home Values in the Area
Average Home Value in this Area
Purchase History
| Date | Buyer | Sale Price | Title Company |
|---|---|---|---|
| Maria L Resendes Irt | -- | None Available | |
| Maria L Resendes Irt | -- | None Available | |
| Resendes Maria | -- | None Available | |
| Resendes Maria | -- | None Available | |
| Resendes Ret Truts | -- | None Available | |
| Resendes Ret Truts | -- | None Available |
Source: Public Records
Tax History
| Year | Tax Paid | Tax Assessment Tax Assessment Total Assessment is a certain percentage of the fair market value that is determined by local assessors to be the total taxable value of land and additions on the property. | Land | Improvement |
|---|---|---|---|---|
| 2025 | $3,846 | $335,900 | $123,700 | $212,200 |
| 2024 | $3,544 | $308,400 | $119,000 | $189,400 |
| 2023 | $3,200 | $260,800 | $102,000 | $158,800 |
| 2022 | $2,929 | $232,100 | $92,700 | $139,400 |
| 2021 | $2,720 | $196,700 | $85,800 | $110,900 |
| 2020 | $2,461 | $170,300 | $82,100 | $88,200 |
| 2019 | $2,328 | $159,700 | $78,200 | $81,500 |
| 2018 | $2,211 | $151,200 | $76,800 | $74,400 |
| 2017 | $2,076 | $148,300 | $78,300 | $70,000 |
| 2016 | $2,042 | $149,800 | $81,600 | $68,200 |
| 2015 | $1,920 | $146,800 | $78,600 | $68,200 |
| 2014 | $1,979 | $157,300 | $82,700 | $74,600 |
Source: Public Records
Map
Nearby Homes
- 884 Cherry St
- 273 Tremont St
- 992 Pine St
- 243 Robeson St Unit 6
- 243 Robeson St Unit 3
- 218 Plain St
- 217 Plain St
- 45-47 Shawmut St
- 545 Robeson St
- 631 Walnut St
- 869 Bedford St
- 511 Bank St
- 610 Walnut St
- 105 16th St
- 120 15th St Unit 5
- 528 Cherry St Unit 3
- 464 Bank St Unit 10
- 84 Healy St
- 501 Pine St
- 89 Oak St
- 235 Orange St
- 935 Cherry St
- 935 Cherry St Unit 2
- 275 Orange St
- 227 Orange St
- 227 Orange St Unit 1
- 238 Orange St
- 896 Cherry St
- 896 Cherry St Unit 1
- 928 Cherry St
- 887 Cherry St
- 246 Davis St
- 219 Orange St Unit 2
- 219 Orange St
- 226 Davis St
- 274 Davis St
- 282 Orange St
- 282 Orange St Unit 2
- 282 Orange St Unit 1
- 886 Cherry St
Your Personal Tour Guide
Ask me questions while you tour the home.