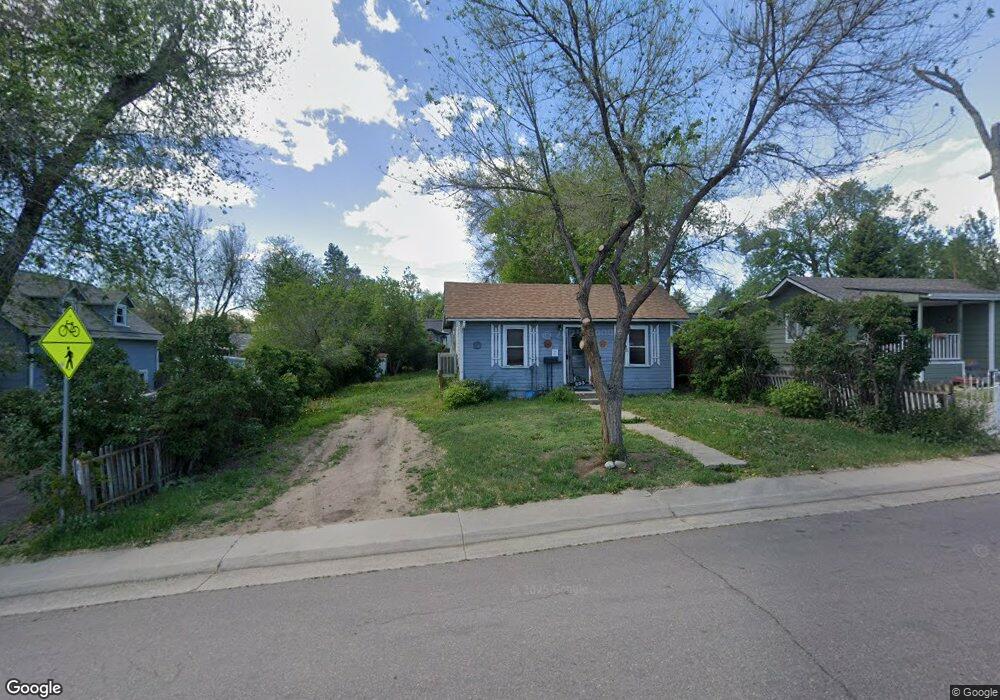
253 Osceola St Denver, CO 80219
Barnum NeighborhoodEstimated Value: $359,401 - $438,000
2
Beds
1
Bath
805
Sq Ft
$490/Sq Ft
Est. Value
About This Home
This home is located at 253 Osceola St, Denver, CO 80219 and is currently estimated at $394,100, approximately $489 per square foot. 253 Osceola St is a home located in Denver County with nearby schools including Newlon Elementary School, Kepner Beacon Middle School, and West High School.
Ownership History
Date
Name
Owned For
Owner Type
Purchase Details
Closed on
Dec 18, 1996
Sold by
Terrel Bradley
Bought by
Avila Kathy Lee
Current Estimated Value
Home Financials for this Owner
Home Financials are based on the most recent Mortgage that was taken out on this home.
Original Mortgage
$75,920
Outstanding Balance
$7,648
Interest Rate
7.6%
Mortgage Type
FHA
Estimated Equity
$386,452
Purchase Details
Closed on
Oct 22, 1996
Sold by
Totheroh Dayne W
Bought by
Terrell Bradley
Home Financials for this Owner
Home Financials are based on the most recent Mortgage that was taken out on this home.
Original Mortgage
$75,920
Outstanding Balance
$7,648
Interest Rate
7.6%
Mortgage Type
FHA
Estimated Equity
$386,452
Create a Home Valuation Report for This Property
The Home Valuation Report is an in-depth analysis detailing your home's value as well as a comparison with similar homes in the area
Home Values in the Area
Average Home Value in this Area
Purchase History
| Date | Buyer | Sale Price | Title Company |
|---|---|---|---|
| Avila Kathy Lee | $76,000 | -- | |
| Terrell Bradley | $53,500 | -- |
Source: Public Records
Mortgage History
| Date | Status | Borrower | Loan Amount |
|---|---|---|---|
| Open | Avila Kathy Lee | $75,920 | |
| Previous Owner | Terrell Bradley | $40,955 |
Source: Public Records
Tax History Compared to Growth
Tax History
| Year | Tax Paid | Tax Assessment Tax Assessment Total Assessment is a certain percentage of the fair market value that is determined by local assessors to be the total taxable value of land and additions on the property. | Land | Improvement |
|---|---|---|---|---|
| 2024 | $1,764 | $22,270 | $6,780 | $15,490 |
| 2023 | $1,726 | $22,270 | $6,780 | $15,490 |
| 2022 | $1,674 | $21,050 | $6,940 | $14,110 |
| 2021 | $1,615 | $21,650 | $7,140 | $14,510 |
| 2020 | $1,365 | $18,400 | $5,810 | $12,590 |
| 2019 | $1,327 | $18,400 | $5,810 | $12,590 |
| 2018 | $986 | $12,740 | $5,400 | $7,340 |
| 2017 | $983 | $12,740 | $5,400 | $7,340 |
| 2016 | $691 | $8,470 | $4,474 | $3,996 |
| 2015 | $662 | $8,470 | $4,474 | $3,996 |
| 2014 | $411 | $4,950 | $2,985 | $1,965 |
Source: Public Records
Map
Nearby Homes