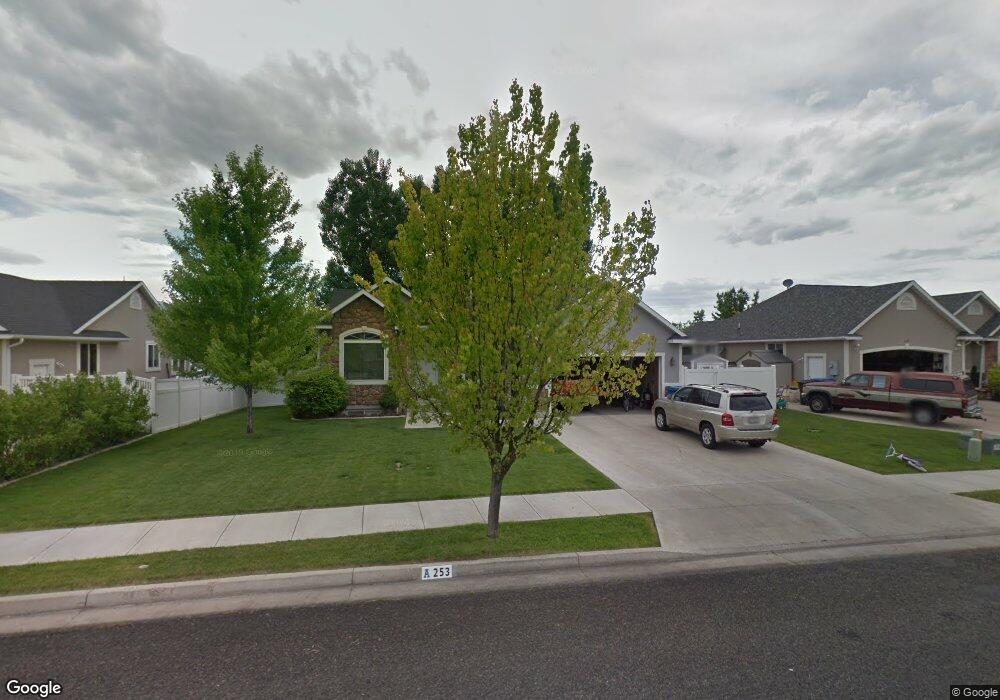
253 S 375 W Providence, UT 84332
Estimated Value: $448,000 - $518,000
Studio
--
Bath
1,504
Sq Ft
$328/Sq Ft
Est. Value
About This Home
This home is located at 253 S 375 W, Providence, UT 84332 and is currently estimated at $492,571, approximately $327 per square foot. 253 S 375 W is a home with nearby schools including River Heights School, Spring Creek Middle School, and South Cache Middle School.
Ownership History
Date
Name
Owned For
Owner Type
Purchase Details
Closed on
Nov 1, 2019
Sold by
Sorensen Charles E and Sorensen Leigh A
Bought by
Sorensen Charles E and Sorensen Leigh A
Current Estimated Value
Home Financials for this Owner
Home Financials are based on the most recent Mortgage that was taken out on this home.
Original Mortgage
$284,900
Outstanding Balance
$250,313
Interest Rate
3.75%
Mortgage Type
FHA
Estimated Equity
$242,258
Purchase Details
Closed on
Mar 8, 2002
Sold by
A J Addison Inc
Bought by
Sorensen Ii Charles E and Sorensen Leigh A
Home Financials for this Owner
Home Financials are based on the most recent Mortgage that was taken out on this home.
Original Mortgage
$155,700
Interest Rate
6.94%
Purchase Details
Closed on
Apr 2, 2001
Sold by
Foxridge Development Co
Bought by
A J Addison Inc
Create a Home Valuation Report for This Property
The Home Valuation Report is an in-depth analysis detailing your home's value as well as a comparison with similar homes in the area
Home Values in the Area
Average Home Value in this Area
Purchase History
| Date | Buyer | Sale Price | Title Company |
|---|---|---|---|
| Sorensen Charles E | -- | Hickman Land Title Logan | |
| Sorensen Ii Charles E | -- | Cache Title Company | |
| A J Addison Inc | -- | Cache Title Company Inc |
Source: Public Records
Mortgage History
| Date | Status | Borrower | Loan Amount |
|---|---|---|---|
| Open | Sorensen Charles E | $284,900 | |
| Closed | Sorensen Ii Charles E | $155,700 |
Source: Public Records
Tax History
| Year | Tax Paid | Tax Assessment Tax Assessment Total Assessment is a certain percentage of the fair market value that is determined by local assessors to be the total taxable value of land and additions on the property. | Land | Improvement |
|---|---|---|---|---|
| 2025 | $2,034 | $285,175 | $0 | $0 |
| 2024 | $2,173 | $283,480 | $0 | $0 |
| 2023 | $2,288 | $281,130 | $0 | $0 |
| 2022 | $209 | $242,630 | $0 | $0 |
| 2021 | $2,052 | $364,920 | $60,000 | $304,920 |
| 2020 | $1,684 | $277,707 | $60,000 | $217,707 |
| 2019 | $1,779 | $277,706 | $60,000 | $217,706 |
| 2018 | $1,564 | $249,310 | $60,000 | $189,310 |
| 2017 | $1,415 | $119,405 | $0 | $0 |
| 2016 | $1,430 | $119,405 | $0 | $0 |
| 2015 | $1,377 | $114,670 | $0 | $0 |
| 2014 | $1,343 | $114,670 | $0 | $0 |
| 2013 | -- | $114,670 | $0 | $0 |
Source: Public Records
Map
Nearby Homes
- 600 W 300 S
- 216 W 225 S
- 185 S 200 W
- 593 W 300 S
- 462 W 40 S Unit 203
- 460 W 15 S Unit G202
- 470 W 15 S Unit F301
- 460 W 15 S Unit G201
- 472 W 40 S Unit 203
- 472 W 40 S Unit 102
- 513 W 400 S Unit 54
- 473 W 40 S Unit H102
- 10 S 410 W
- 645 Garden Dr
- 497 W 400 S
- 520 W 400 S
- 504 W 400 S
- 500 W 400 S
- 509 W 400 S
- 508 S 200 W
Your Personal Tour Guide
Ask me questions while you tour the home.