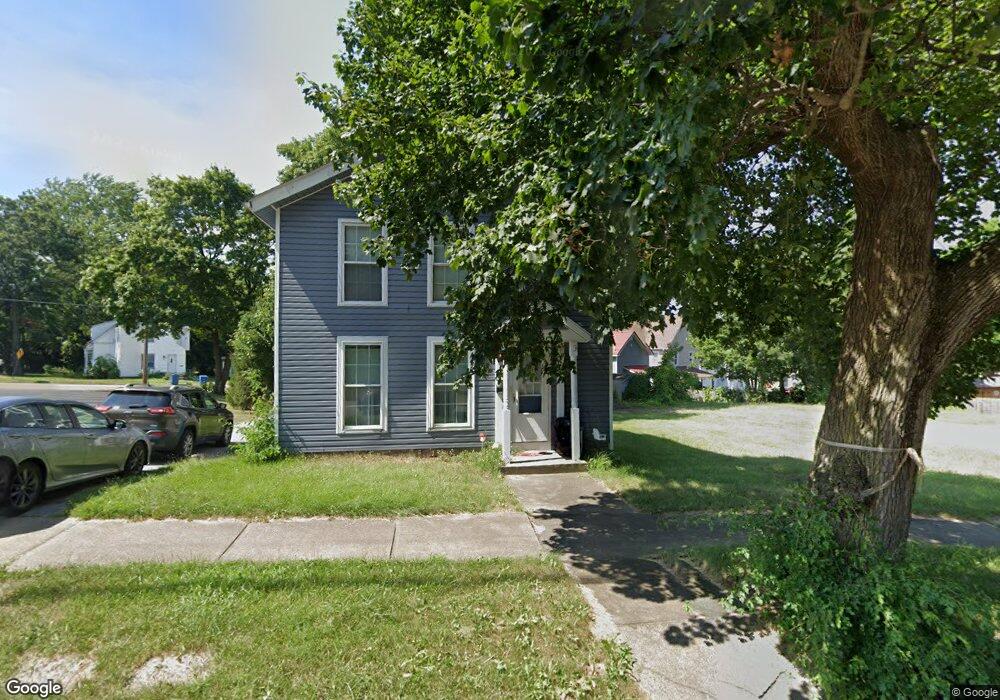
253 S Bridge St Struthers, OH 44471
Estimated Value: $81,000 - $99,971
2
Beds
2
Baths
1,008
Sq Ft
$90/Sq Ft
Est. Value
About This Home
This home is located at 253 S Bridge St, Struthers, OH 44471 and is currently estimated at $90,243, approximately $89 per square foot. 253 S Bridge St is a home located in Mahoning County with nearby schools including Struthers Elementary School, Struthers Middle School, and Struthers High School.
Ownership History
Date
Name
Owned For
Owner Type
Purchase Details
Closed on
Oct 1, 2015
Sold by
Perrotta Frank and Perrotta Kathleen A
Bought by
Georgaris Leslie A and Georgaris James G
Current Estimated Value
Home Financials for this Owner
Home Financials are based on the most recent Mortgage that was taken out on this home.
Original Mortgage
$28,000
Outstanding Balance
$22,053
Interest Rate
3.91%
Mortgage Type
New Conventional
Estimated Equity
$68,190
Purchase Details
Closed on
Sep 25, 2007
Sold by
Perrotta Frank
Bought by
Perrotta Frank and Perrotta Kathy
Purchase Details
Closed on
Nov 9, 1990
Sold by
Perrotta Frances
Bought by
Perrotta Mary Ann
Purchase Details
Closed on
Oct 14, 1969
Sold by
Angelilli Lorenzina P
Bought by
Angelilli Giuseppe
Purchase Details
Closed on
Jun 12, 1969
Sold by
Angelilli Giuseppe
Bought by
Angelilli Giuseppe
Create a Home Valuation Report for This Property
The Home Valuation Report is an in-depth analysis detailing your home's value as well as a comparison with similar homes in the area
Home Values in the Area
Average Home Value in this Area
Purchase History
| Date | Buyer | Sale Price | Title Company |
|---|---|---|---|
| Georgaris Leslie A | $35,000 | Attorney | |
| Perrotta Frank | -- | Attorney | |
| Perrotta Mary Ann | -- | -- | |
| Angelilli Giuseppe | -- | -- | |
| Angelilli Giuseppe | -- | -- |
Source: Public Records
Mortgage History
| Date | Status | Borrower | Loan Amount |
|---|---|---|---|
| Open | Georgaris Leslie A | $28,000 |
Source: Public Records
Tax History Compared to Growth
Tax History
| Year | Tax Paid | Tax Assessment Tax Assessment Total Assessment is a certain percentage of the fair market value that is determined by local assessors to be the total taxable value of land and additions on the property. | Land | Improvement |
|---|---|---|---|---|
| 2024 | $423 | $19,900 | $1,630 | $18,270 |
| 2023 | $441 | $19,900 | $1,630 | $18,270 |
| 2022 | $125 | $11,020 | $1,630 | $9,390 |
| 2021 | $124 | $11,020 | $1,630 | $9,390 |
| 2020 | $125 | $11,020 | $1,630 | $9,390 |
| 2019 | $140 | $11,020 | $1,630 | $9,390 |
| 2018 | $134 | $11,020 | $1,630 | $9,390 |
| 2017 | $131 | $11,020 | $1,630 | $9,390 |
| 2016 | $195 | $12,250 | $1,960 | $10,290 |
| 2015 | $211 | $12,250 | $1,960 | $10,290 |
| 2014 | $424 | $16,570 | $1,960 | $14,610 |
| 2013 | $367 | $16,570 | $1,960 | $14,610 |
Source: Public Records
Map
Nearby Homes