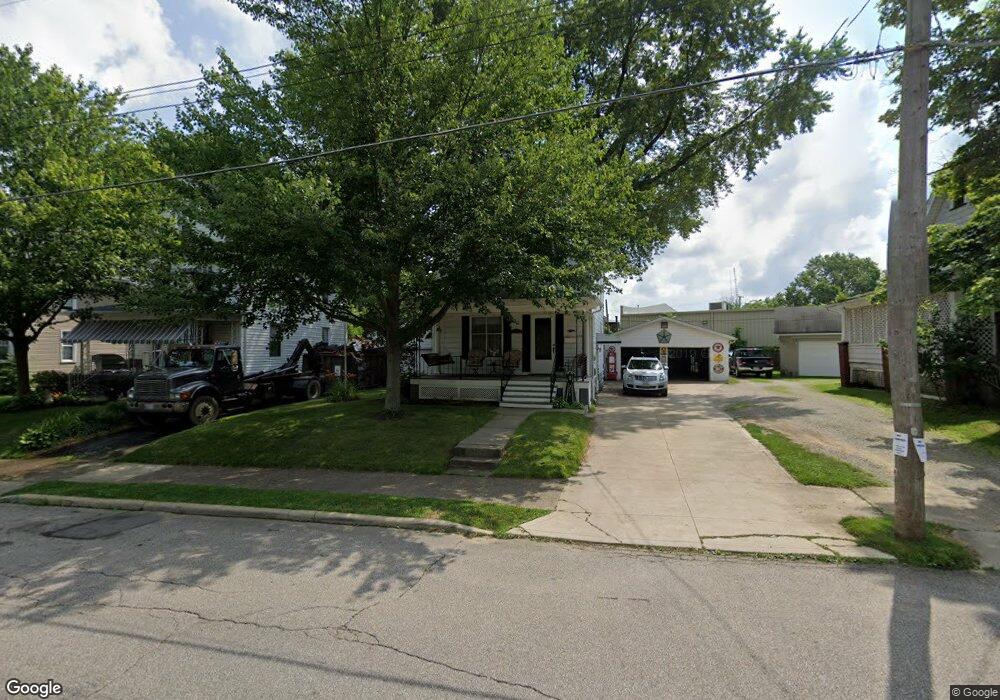
253 S Mulberry St Mansfield, OH 44903
Estimated Value: $88,000 - $145,000
3
Beds
2
Baths
1,460
Sq Ft
$83/Sq Ft
Est. Value
About This Home
This home is located at 253 S Mulberry St, Mansfield, OH 44903 and is currently estimated at $120,529, approximately $82 per square foot. 253 S Mulberry St is a home located in Richland County with nearby schools including St. Peter's Elementary/Montessori School, St. Peter's High School/Junior High, and Discovery School.
Ownership History
Date
Name
Owned For
Owner Type
Purchase Details
Closed on
Nov 14, 2023
Sold by
Frisk Elaine and Ferrell Annette
Bought by
Mills Julia
Current Estimated Value
Purchase Details
Closed on
Sep 6, 1995
Sold by
Dillon Betty J
Bought by
Dillon Kevin E
Home Financials for this Owner
Home Financials are based on the most recent Mortgage that was taken out on this home.
Original Mortgage
$28,000
Interest Rate
7.76%
Mortgage Type
New Conventional
Create a Home Valuation Report for This Property
The Home Valuation Report is an in-depth analysis detailing your home's value as well as a comparison with similar homes in the area
Home Values in the Area
Average Home Value in this Area
Purchase History
| Date | Buyer | Sale Price | Title Company |
|---|---|---|---|
| Mills Julia | -- | None Listed On Document | |
| Dillon Kevin E | $35,000 | -- |
Source: Public Records
Mortgage History
| Date | Status | Borrower | Loan Amount |
|---|---|---|---|
| Previous Owner | Dillon Kevin E | $28,000 |
Source: Public Records
Tax History Compared to Growth
Tax History
| Year | Tax Paid | Tax Assessment Tax Assessment Total Assessment is a certain percentage of the fair market value that is determined by local assessors to be the total taxable value of land and additions on the property. | Land | Improvement |
|---|---|---|---|---|
| 2024 | $999 | $21,870 | $3,020 | $18,850 |
| 2023 | $999 | $21,870 | $3,020 | $18,850 |
| 2022 | $782 | $13,990 | $2,470 | $11,520 |
| 2021 | $787 | $13,990 | $2,470 | $11,520 |
| 2020 | $805 | $13,990 | $2,470 | $11,520 |
| 2019 | $892 | $13,990 | $2,470 | $11,520 |
| 2018 | $880 | $13,990 | $2,470 | $11,520 |
| 2017 | $924 | $13,990 | $2,470 | $11,520 |
| 2016 | $992 | $15,710 | $2,850 | $12,860 |
| 2015 | $992 | $15,710 | $2,850 | $12,860 |
| 2014 | $935 | $15,710 | $2,850 | $12,860 |
| 2012 | $356 | $15,710 | $3,000 | $12,710 |
Source: Public Records
Map
Nearby Homes
- 96 Glenwood Heights
- 212 S Main St
- 186 S Mulberry St
- 259 S Main St
- 286 S Main St
- 37 W Arch St
- 137 Lexington Ave
- 273 Hammond Ave
- 188 S Franklin Ave
- 120 Grover St
- 172 -172 1 2 Lexington Ave
- 217 S Franklin Ave
- 327 Hammond Ave
- 394 S Main St
- 353 Sturges Ave
- 319 Altamont Ave
- 131 Sturges Ave
- 375 Sturges Ave
- 116 W 2nd St
- 0 N Adams St
- 254 S Mulberry St
- 251 S Mulberry St
- 255 S Mulberry St
- 243 S Mulberry St
- 237 S Mulberry St
- 248 S Mulberry St
- 234 S Mulberry St
- 235 S Mulberry St
- 229 N St
- 270 S Mulberry St
- 231 S Mulberry St
- 274 S Mulberry St
- 240 S Mulberry St
- 240 S Mulberry St
- 240 S Mulberry St
- 232 S Mulberry St
- 78 Lexington Ave
- 278 S Mulberry St
- 228 S Mulberry St
- 125 Glenwood Heights