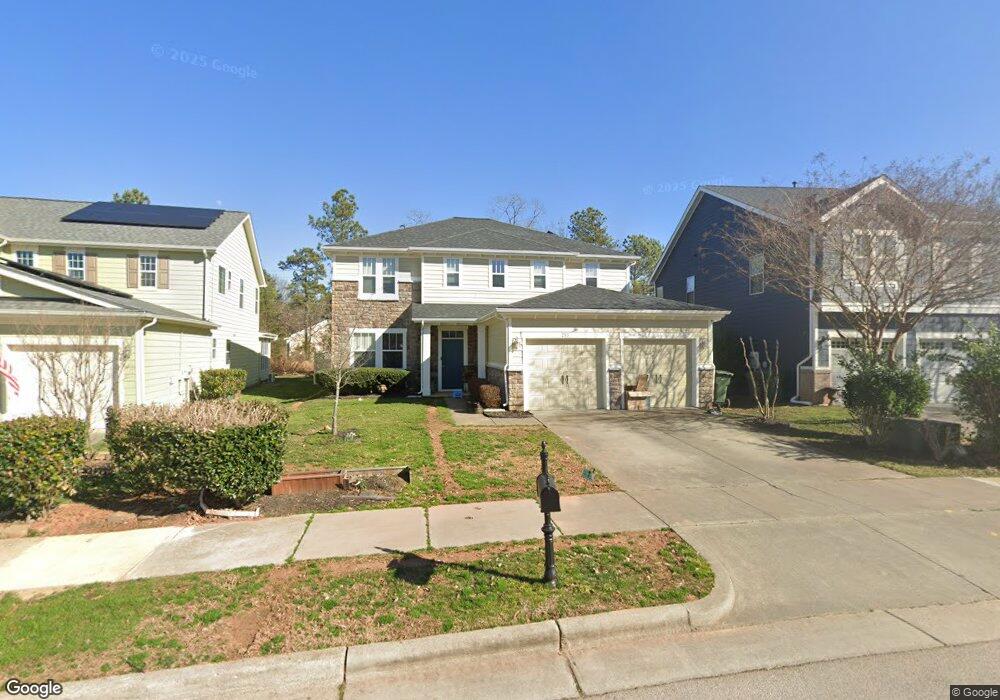
253 Seymour Place Cary, NC 27519
Twin Lakes NeighborhoodEstimated Value: $667,000 - $708,000
4
Beds
3
Baths
2,723
Sq Ft
$251/Sq Ft
Est. Value
About This Home
This home is located at 253 Seymour Place, Cary, NC 27519 and is currently estimated at $683,592, approximately $251 per square foot. 253 Seymour Place is a home located in Wake County with nearby schools including Cedar Fork Elementary, West Cary Middle School, and Panther Creek High School.
Ownership History
Date
Name
Owned For
Owner Type
Purchase Details
Closed on
Nov 30, 2020
Sold by
Hu Dan and Shan Dan
Bought by
Zhong Jizhen
Current Estimated Value
Purchase Details
Closed on
Nov 30, 2018
Sold by
Gross Joseph A and Gross Elizabeth
Bought by
Hu Dan
Purchase Details
Closed on
Oct 29, 2015
Sold by
Joo Sung Chul and Lee Sun Yong
Bought by
Gross Elizabeth and Gross Joseph A
Home Financials for this Owner
Home Financials are based on the most recent Mortgage that was taken out on this home.
Original Mortgage
$276,000
Interest Rate
3.93%
Mortgage Type
New Conventional
Purchase Details
Closed on
Jun 30, 2010
Sold by
Kb Home Raleigh Durham Inc
Bought by
Joo Sung Chul and Lee Sun Yong
Home Financials for this Owner
Home Financials are based on the most recent Mortgage that was taken out on this home.
Original Mortgage
$279,076
Interest Rate
4.25%
Mortgage Type
FHA
Create a Home Valuation Report for This Property
The Home Valuation Report is an in-depth analysis detailing your home's value as well as a comparison with similar homes in the area
Home Values in the Area
Average Home Value in this Area
Purchase History
| Date | Buyer | Sale Price | Title Company |
|---|---|---|---|
| Zhong Jizhen | $427,000 | None Available | |
| Zhong Jizhen | $427,000 | None Listed On Document | |
| Hu Dan | $382,000 | None Available | |
| Gross Elizabeth | $345,000 | Attorney | |
| Joo Sung Chul | $275,500 | None Available |
Source: Public Records
Mortgage History
| Date | Status | Borrower | Loan Amount |
|---|---|---|---|
| Previous Owner | Gross Elizabeth | $276,000 | |
| Previous Owner | Joo Sung Chul | $279,076 |
Source: Public Records
Tax History Compared to Growth
Tax History
| Year | Tax Paid | Tax Assessment Tax Assessment Total Assessment is a certain percentage of the fair market value that is determined by local assessors to be the total taxable value of land and additions on the property. | Land | Improvement |
|---|---|---|---|---|
| 2025 | $5,441 | $632,456 | $180,000 | $452,456 |
| 2024 | $5,323 | $632,456 | $180,000 | $452,456 |
| 2023 | $4,192 | $416,360 | $90,000 | $326,360 |
| 2022 | $4,036 | $416,360 | $90,000 | $326,360 |
| 2021 | $3,955 | $416,360 | $90,000 | $326,360 |
| 2020 | $3,975 | $416,360 | $90,000 | $326,360 |
| 2019 | $3,706 | $344,255 | $78,000 | $266,255 |
| 2018 | $3,478 | $344,255 | $78,000 | $266,255 |
| 2017 | $3,342 | $344,255 | $78,000 | $266,255 |
| 2016 | $3,292 | $344,255 | $78,000 | $266,255 |
| 2015 | $3,190 | $322,001 | $60,000 | $262,001 |
| 2014 | -- | $322,001 | $60,000 | $262,001 |
Source: Public Records
Map
Nearby Homes
- 313 Plank Bridge Way
- 605 Beech Hanger Dr
- 106 Honeycomb Ln
- 207 Hampshire Downs Dr
- 234 Hampshire Downs Dr
- 116 Plank Bridge Way
- 417 Downing Glen Dr
- 226 Leacroft Way
- 712 Pierside Dr
- 309 Malvern Hill Ln
- 716 Pierside Dr
- 200 Indian Branch Dr
- 1329 Alemany St
- 1313 Alemany St
- 501 Tranquil Sound Dr
- 103 Trumbell Cir
- 111 Governors House Dr
- 2010 Rapid Falls Rd
- Luna Plan at Parc at Town Center
- 364 Church St
- 257 Seymour Place
- 249 Seymour Place
- 261 Seymour Place
- 245 Seymour Place
- 265 Seymour Place
- 252 Seymour Place
- 241 Seymour Place
- 244 Seymour Place
- 256 Seymour Place
- 260 Seymour Place
- 438 Plank Bridge Way
- 240 Seymour Place
- 269 Seymour Place
- 237 Seymour Place
- 436 Plank Bridge Way
- 911 Iverton Ln
- 434 Plank Bridge Way
- 236 Seymour Place
- 273 Seymour Place
- 417 Plank Bridge Way