Estimated Value: $777,000 - $1,019,000
5
Beds
4
Baths
5,482
Sq Ft
$162/Sq Ft
Est. Value
About This Home
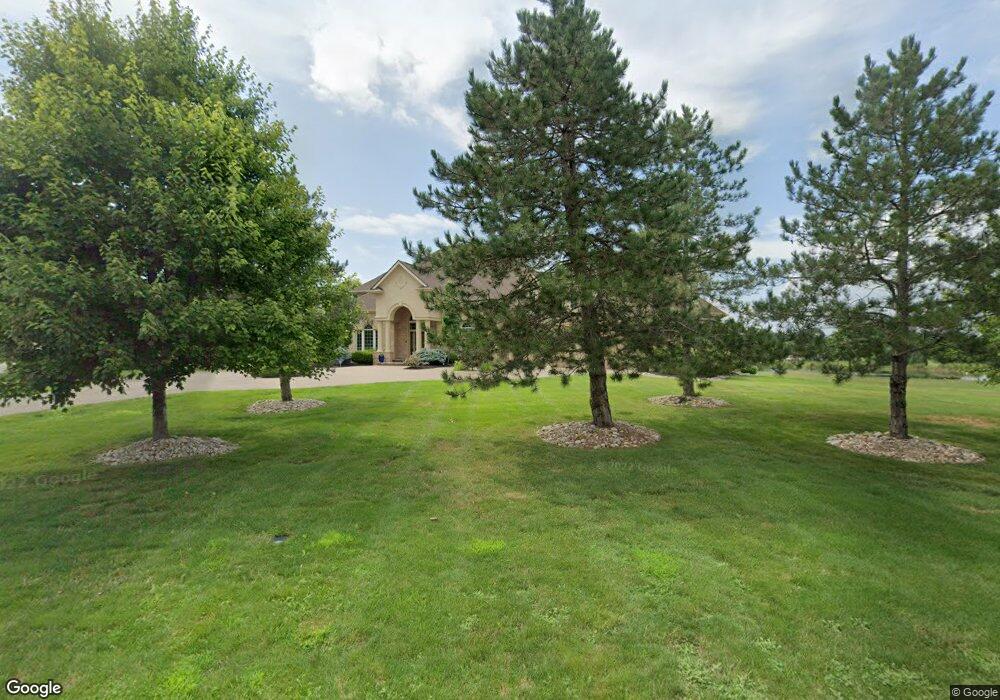
This home is located at 253 Shepherd Rd, Xenia, OH 45385 and is currently estimated at $886,960, approximately $161 per square foot. 253 Shepherd Rd is a home located in Greene County with nearby schools including Trebein Elementary School, Jacob Coy Middle School, and Beavercreek High School.
Ownership History
Date
Name
Owned For
Owner Type
Purchase Details
Closed on
Sep 20, 2019
Sold by
Schulz Andrew P and Schulz Melissa M
Bought by
Shepherd William Lee and Shepherd Anita L
Current Estimated Value
Home Financials for this Owner
Home Financials are based on the most recent Mortgage that was taken out on this home.
Original Mortgage
$552,337
Outstanding Balance
$482,806
Interest Rate
3.5%
Mortgage Type
VA
Estimated Equity
$404,154
Purchase Details
Closed on
Jun 24, 2016
Sold by
Knoth Donald E and Knoth Wanda M
Bought by
Schulz Andrew P and Schulz Melissa M
Home Financials for this Owner
Home Financials are based on the most recent Mortgage that was taken out on this home.
Original Mortgage
$488,750
Interest Rate
3.64%
Mortgage Type
New Conventional
Purchase Details
Closed on
Apr 1, 1999
Sold by
Partnership Nbl Development Group Limited
Bought by
Knoth Donald E and Knoth Wanda M
Create a Home Valuation Report for This Property
The Home Valuation Report is an in-depth analysis detailing your home's value as well as a comparison with similar homes in the area
Home Values in the Area
Average Home Value in this Area
Purchase History
| Date | Buyer | Sale Price | Title Company |
|---|---|---|---|
| Shepherd William Lee | $575,000 | None Available | |
| Schulz Andrew P | $575,000 | None Available | |
| Knoth Donald E | $125,000 | -- |
Source: Public Records
Mortgage History
| Date | Status | Borrower | Loan Amount |
|---|---|---|---|
| Open | Shepherd William Lee | $552,337 | |
| Previous Owner | Schulz Andrew P | $488,750 |
Source: Public Records
Tax History Compared to Growth
Tax History
| Year | Tax Paid | Tax Assessment Tax Assessment Total Assessment is a certain percentage of the fair market value that is determined by local assessors to be the total taxable value of land and additions on the property. | Land | Improvement |
|---|---|---|---|---|
| 2024 | $14,518 | $252,790 | $31,500 | $221,290 |
| 2023 | $14,518 | $252,790 | $31,500 | $221,290 |
| 2022 | $14,423 | $220,190 | $31,500 | $188,690 |
| 2021 | $14,567 | $220,190 | $31,500 | $188,690 |
| 2020 | $14,637 | $220,190 | $31,500 | $188,690 |
| 2019 | $15,885 | $224,010 | $28,350 | $195,660 |
| 2018 | $13,846 | $224,010 | $28,350 | $195,660 |
| 2017 | $13,582 | $224,010 | $28,350 | $195,660 |
| 2016 | $13,449 | $214,740 | $28,350 | $186,390 |
| 2015 | $13,534 | $214,740 | $28,350 | $186,390 |
| 2014 | $13,218 | $214,740 | $28,350 | $186,390 |
Source: Public Records
Map
Nearby Homes
- 295 Stratford Ln
- 463 Valhalla Ct
- 2436 Sherbourne Way
- 139 Signature Dr S
- 2353 Sherwood Ct
- 2284 Annandale Place
- 2178 Annandale Place
- 29 Governors Club Dr
- Congressional Plan at Country Club of the North - Luxury Series
- Somerset Plan at Country Club of the North - Signature Series
- Addington Plan at Country Club of the North - Luxury Series
- Heatherwood Plan at Country Club of the North - Signature Series
- Savannah Plan at Country Club of the North - Luxury Series
- Crooked Stick Plan at Country Club of the North - Signature Series
- Breton Plan at Country Club of the North - Luxury Series
- Oakmont Plan at Country Club of the North - Signature Series
- Arcadia Plan at Country Club of the North - Luxury Series
- Shadow Creek Plan at Country Club of the North - Signature Series
- Rubicon Plan at Country Club of the North - Signature Series
- Southern Hills Plan at Country Club of the North - Luxury Series
- 265 Shepherd Rd
- 277 Shepherd Rd
- 275 Stratford Ln
- 265 Stratford Ln
- 255 Stratford Ln
- 285 Shepherd Rd
- 285 Stratford Ln
- 245 Stratford Ln
- 270 Stratford Ln
- 220 Signature Dr S
- 305 Stratford Ln
- 280 Stratford Ln
- 260 Stratford Ln
- 232 Signature Dr S
- 2321 Abbey Ln
- 290 Stratford Ln
- 199 Wynstone Ct
- 290 Stratford Ln
- 193 Wynstone Ct
- 315 Stratford Ln